

A conversion funnel is the path users take toward a goal — signing up, subscribing, or buying — and the report that shows how many of them make it through each step. Funnels are one of the most useful reports in product analytics, because they show you exactly where people drop off. This guide walks you through what a conversion funnel is, how to build one, and how to fix the leaks.
What is a conversion funnel?
A conversion funnel is a series of steps a user moves through on the way to a goal, where each step has fewer people than the one before it. Think of a kitchen funnel: wide at the top, narrow at the bottom. On a recipe site, users might view a recipe, then save it, then mark it as cooked — and some people drop off at every step, making the funnel narrower as it goes.
The steps you pick depend on your product:
- SaaS signup funnel: landing page → sign up → activate → upgrade
- Ecommerce funnel: product view → add to cart → checkout → purchase
- Content funnel: article view → save → return visit
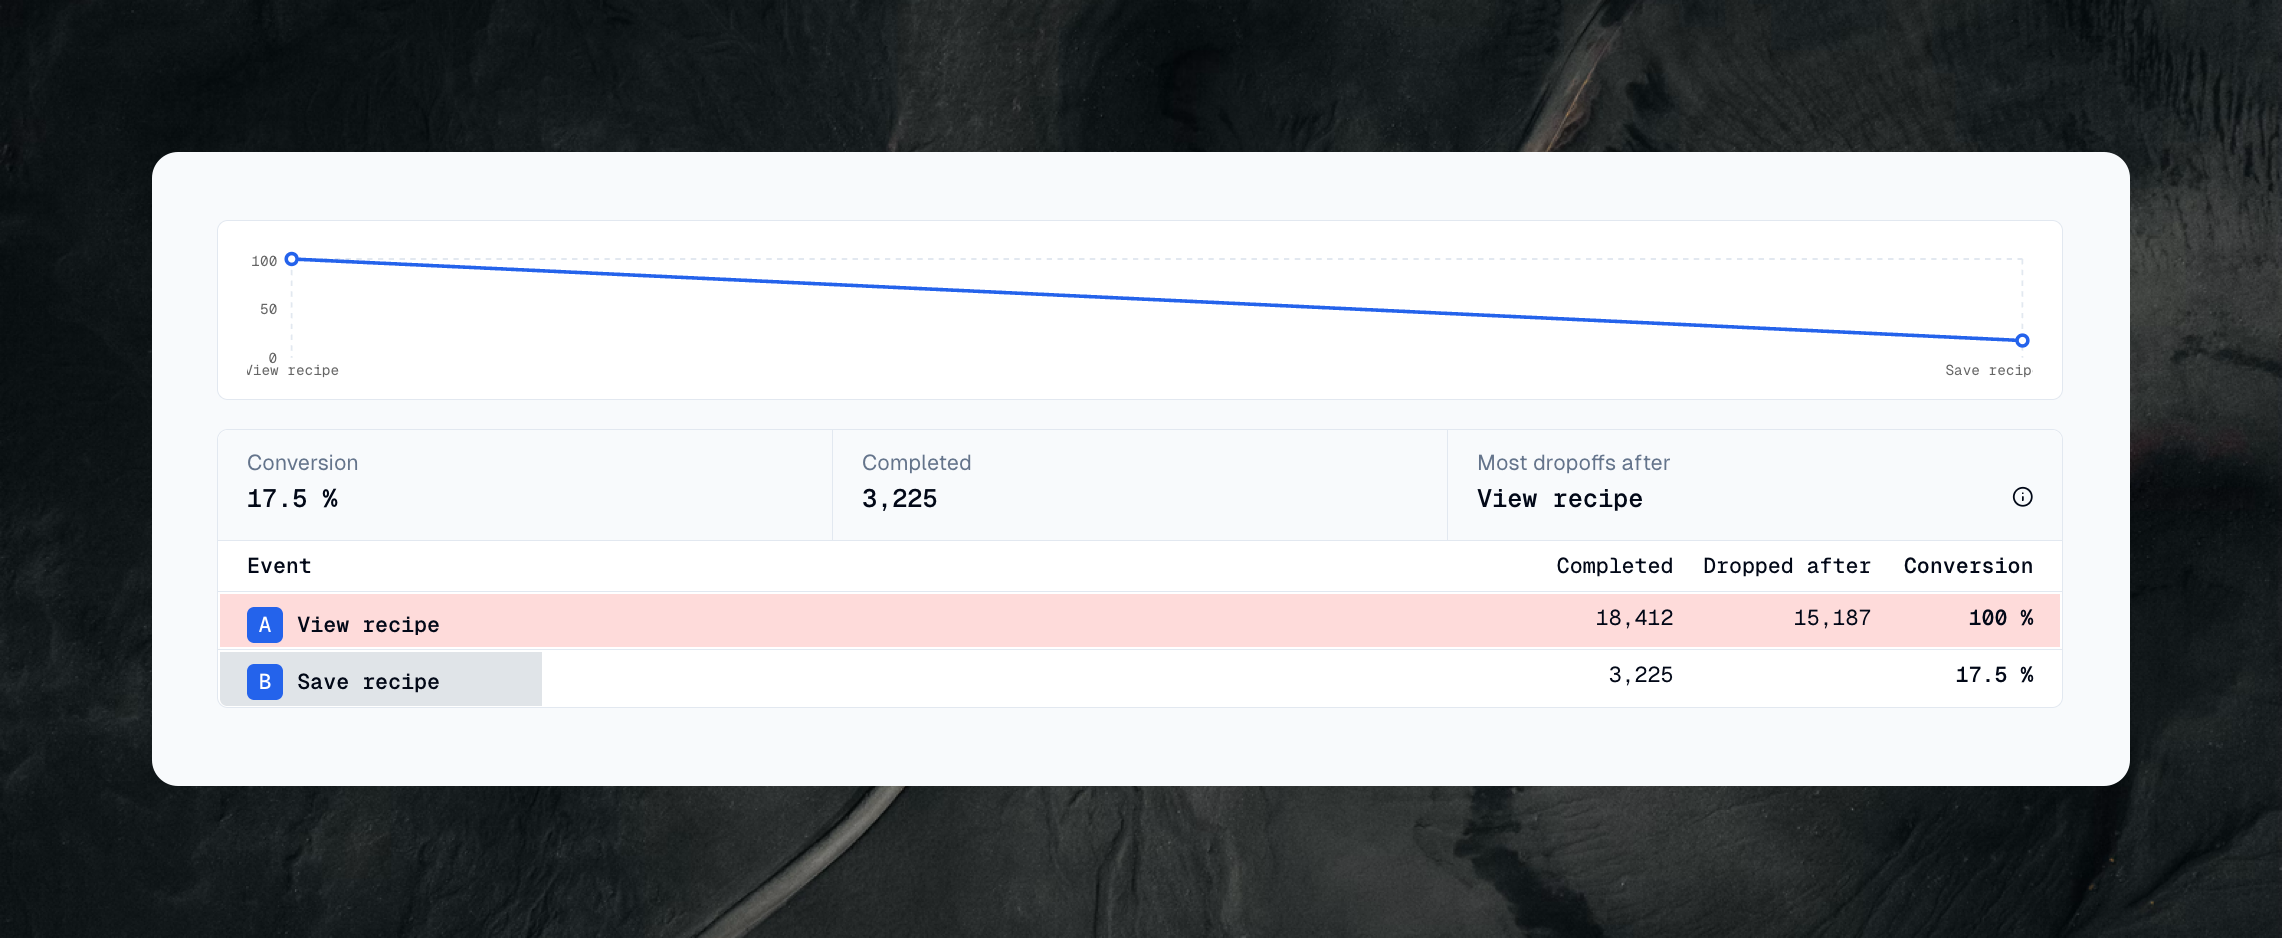
The conversion rate is the percentage of people who make it from one step to the next, or all the way through. If 1,000 people view a recipe and 175 save it, that step converts at 17.5%. A conversion funnel turns "we're losing people somewhere" into "we're losing 60% of people between add-to-cart and checkout" — a problem you can actually fix.
Why do you need a conversion funnel?
Conversion funnels show you where users get stuck or leave your process. Instead of guessing what's wrong, you see exactly where users lose interest or hit a problem, so you know where to make improvements. Pair a funnel with retention reports and you see not just whether people convert, but whether they stick around afterward.
Creating your first funnel
Creating a funnel is straightforward. Here's the process:
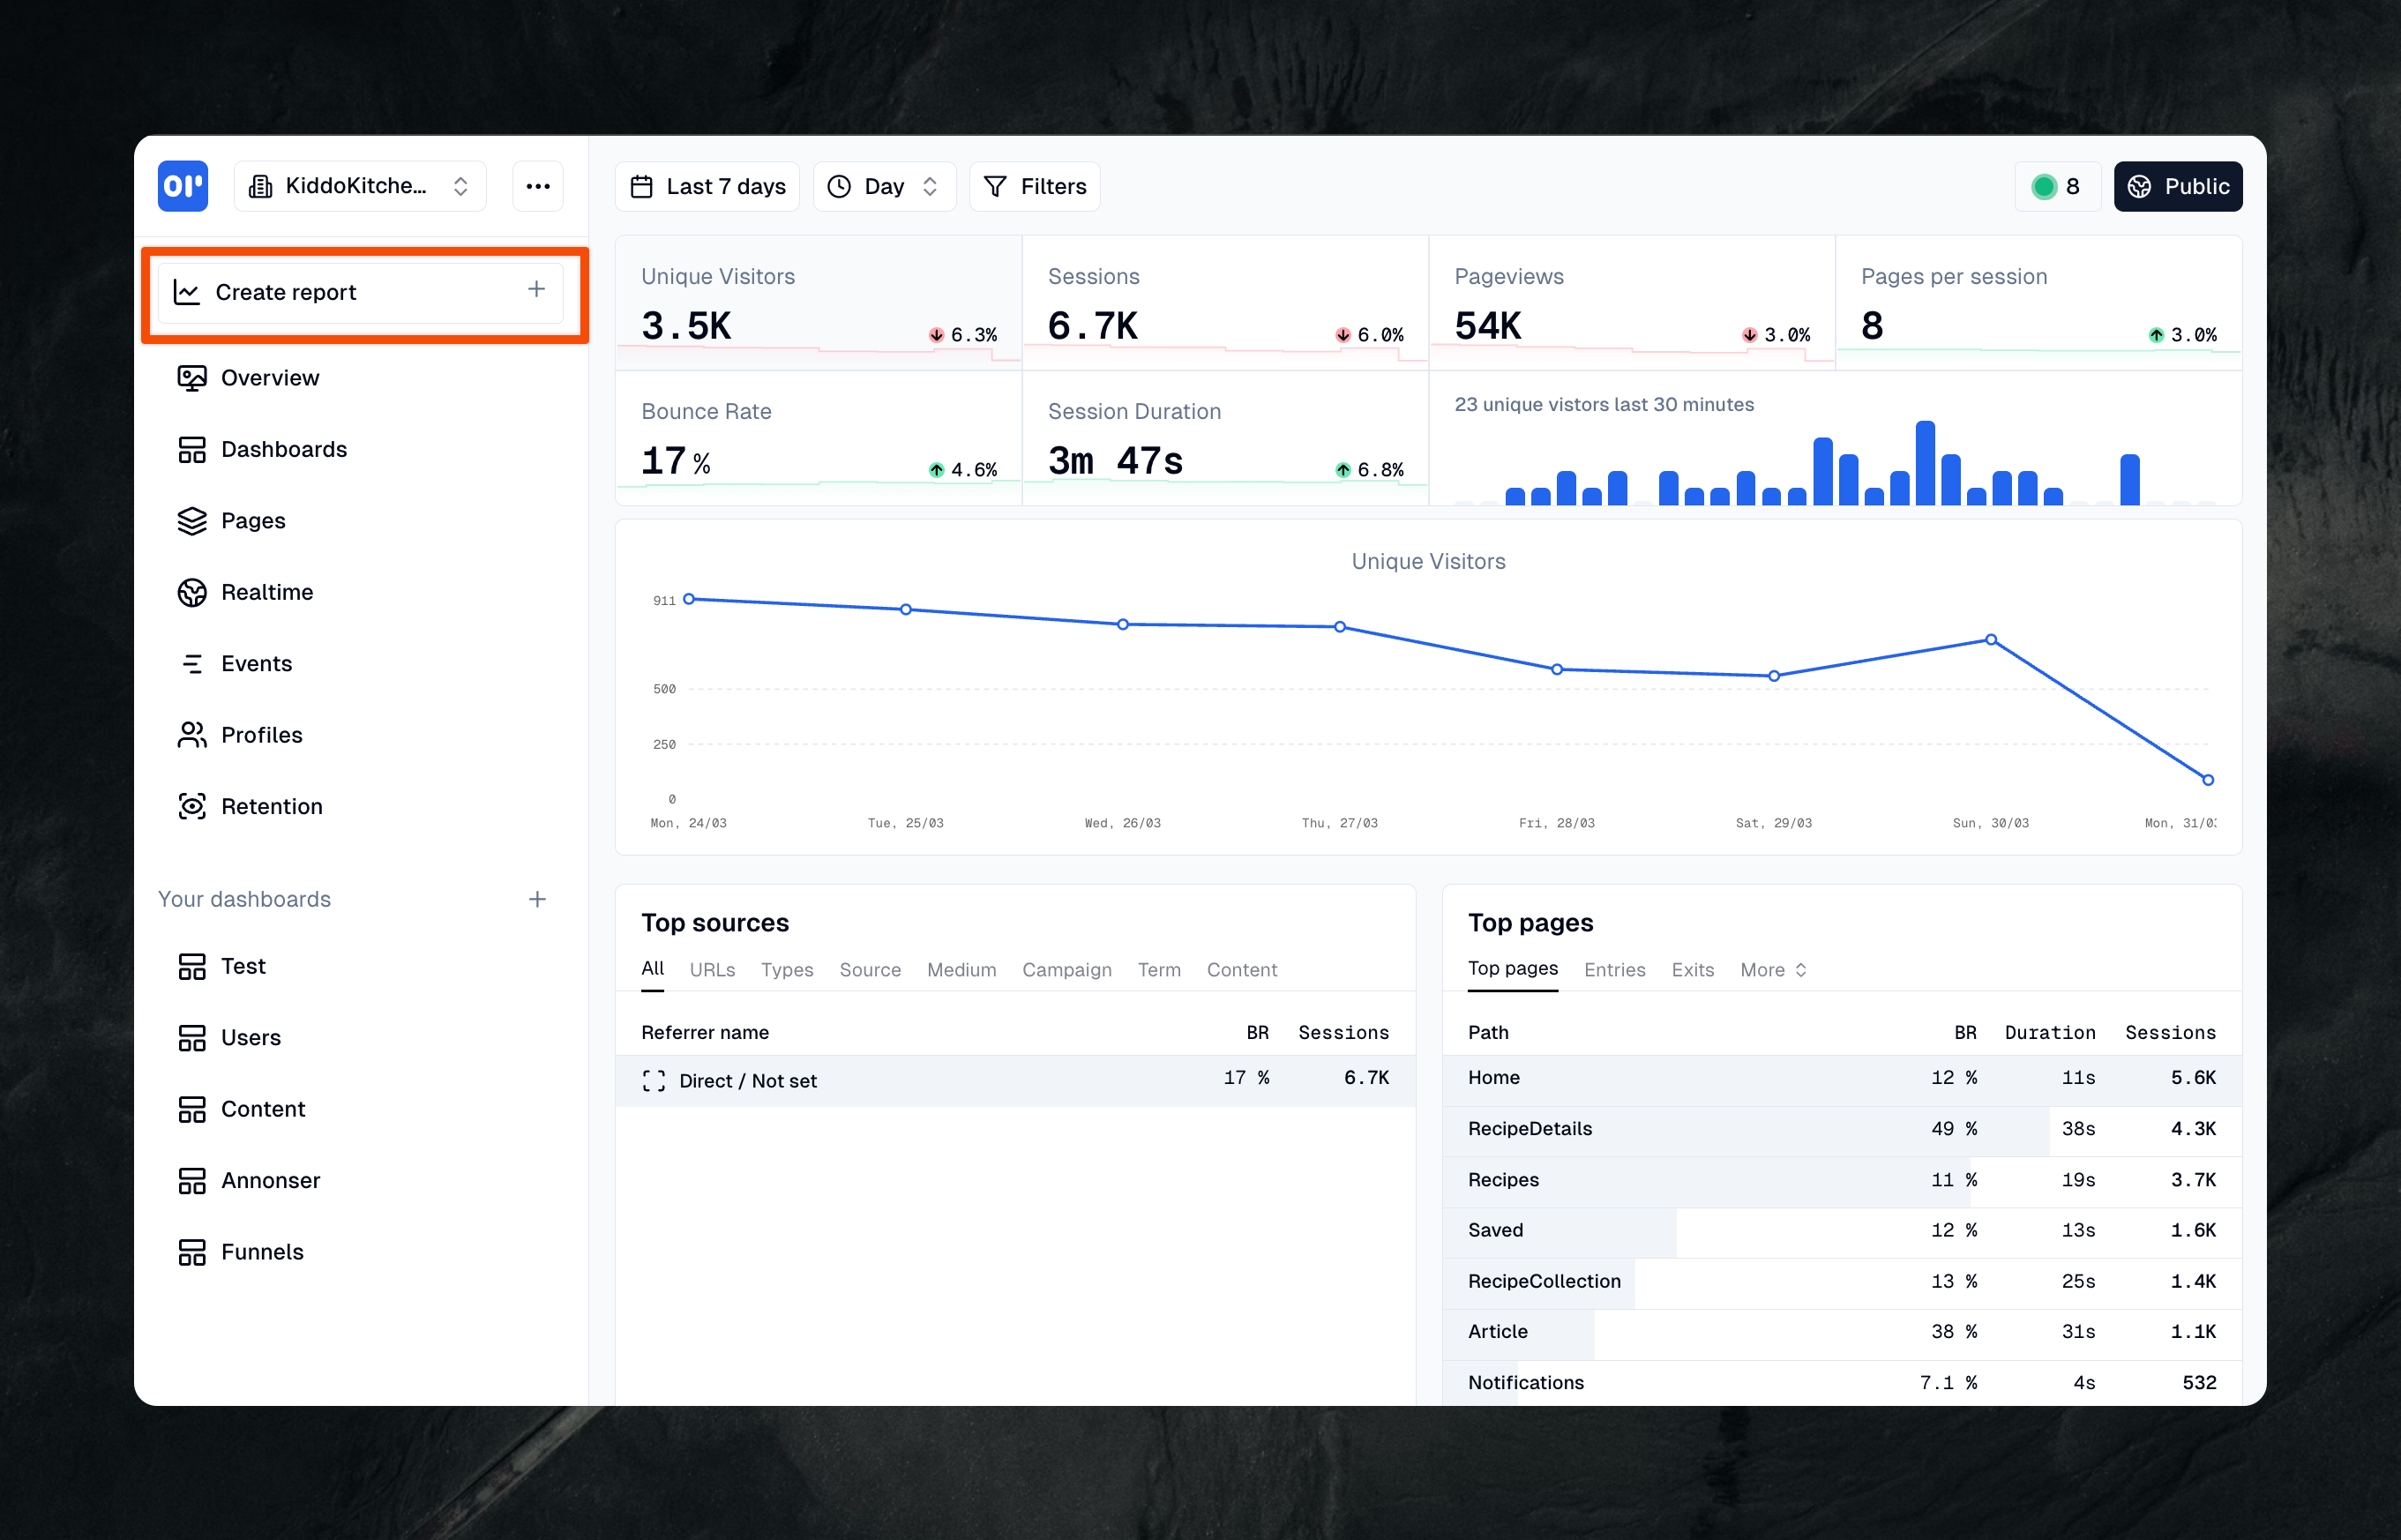
1. Create a report
As with any report you will need to click "Create report" to get going
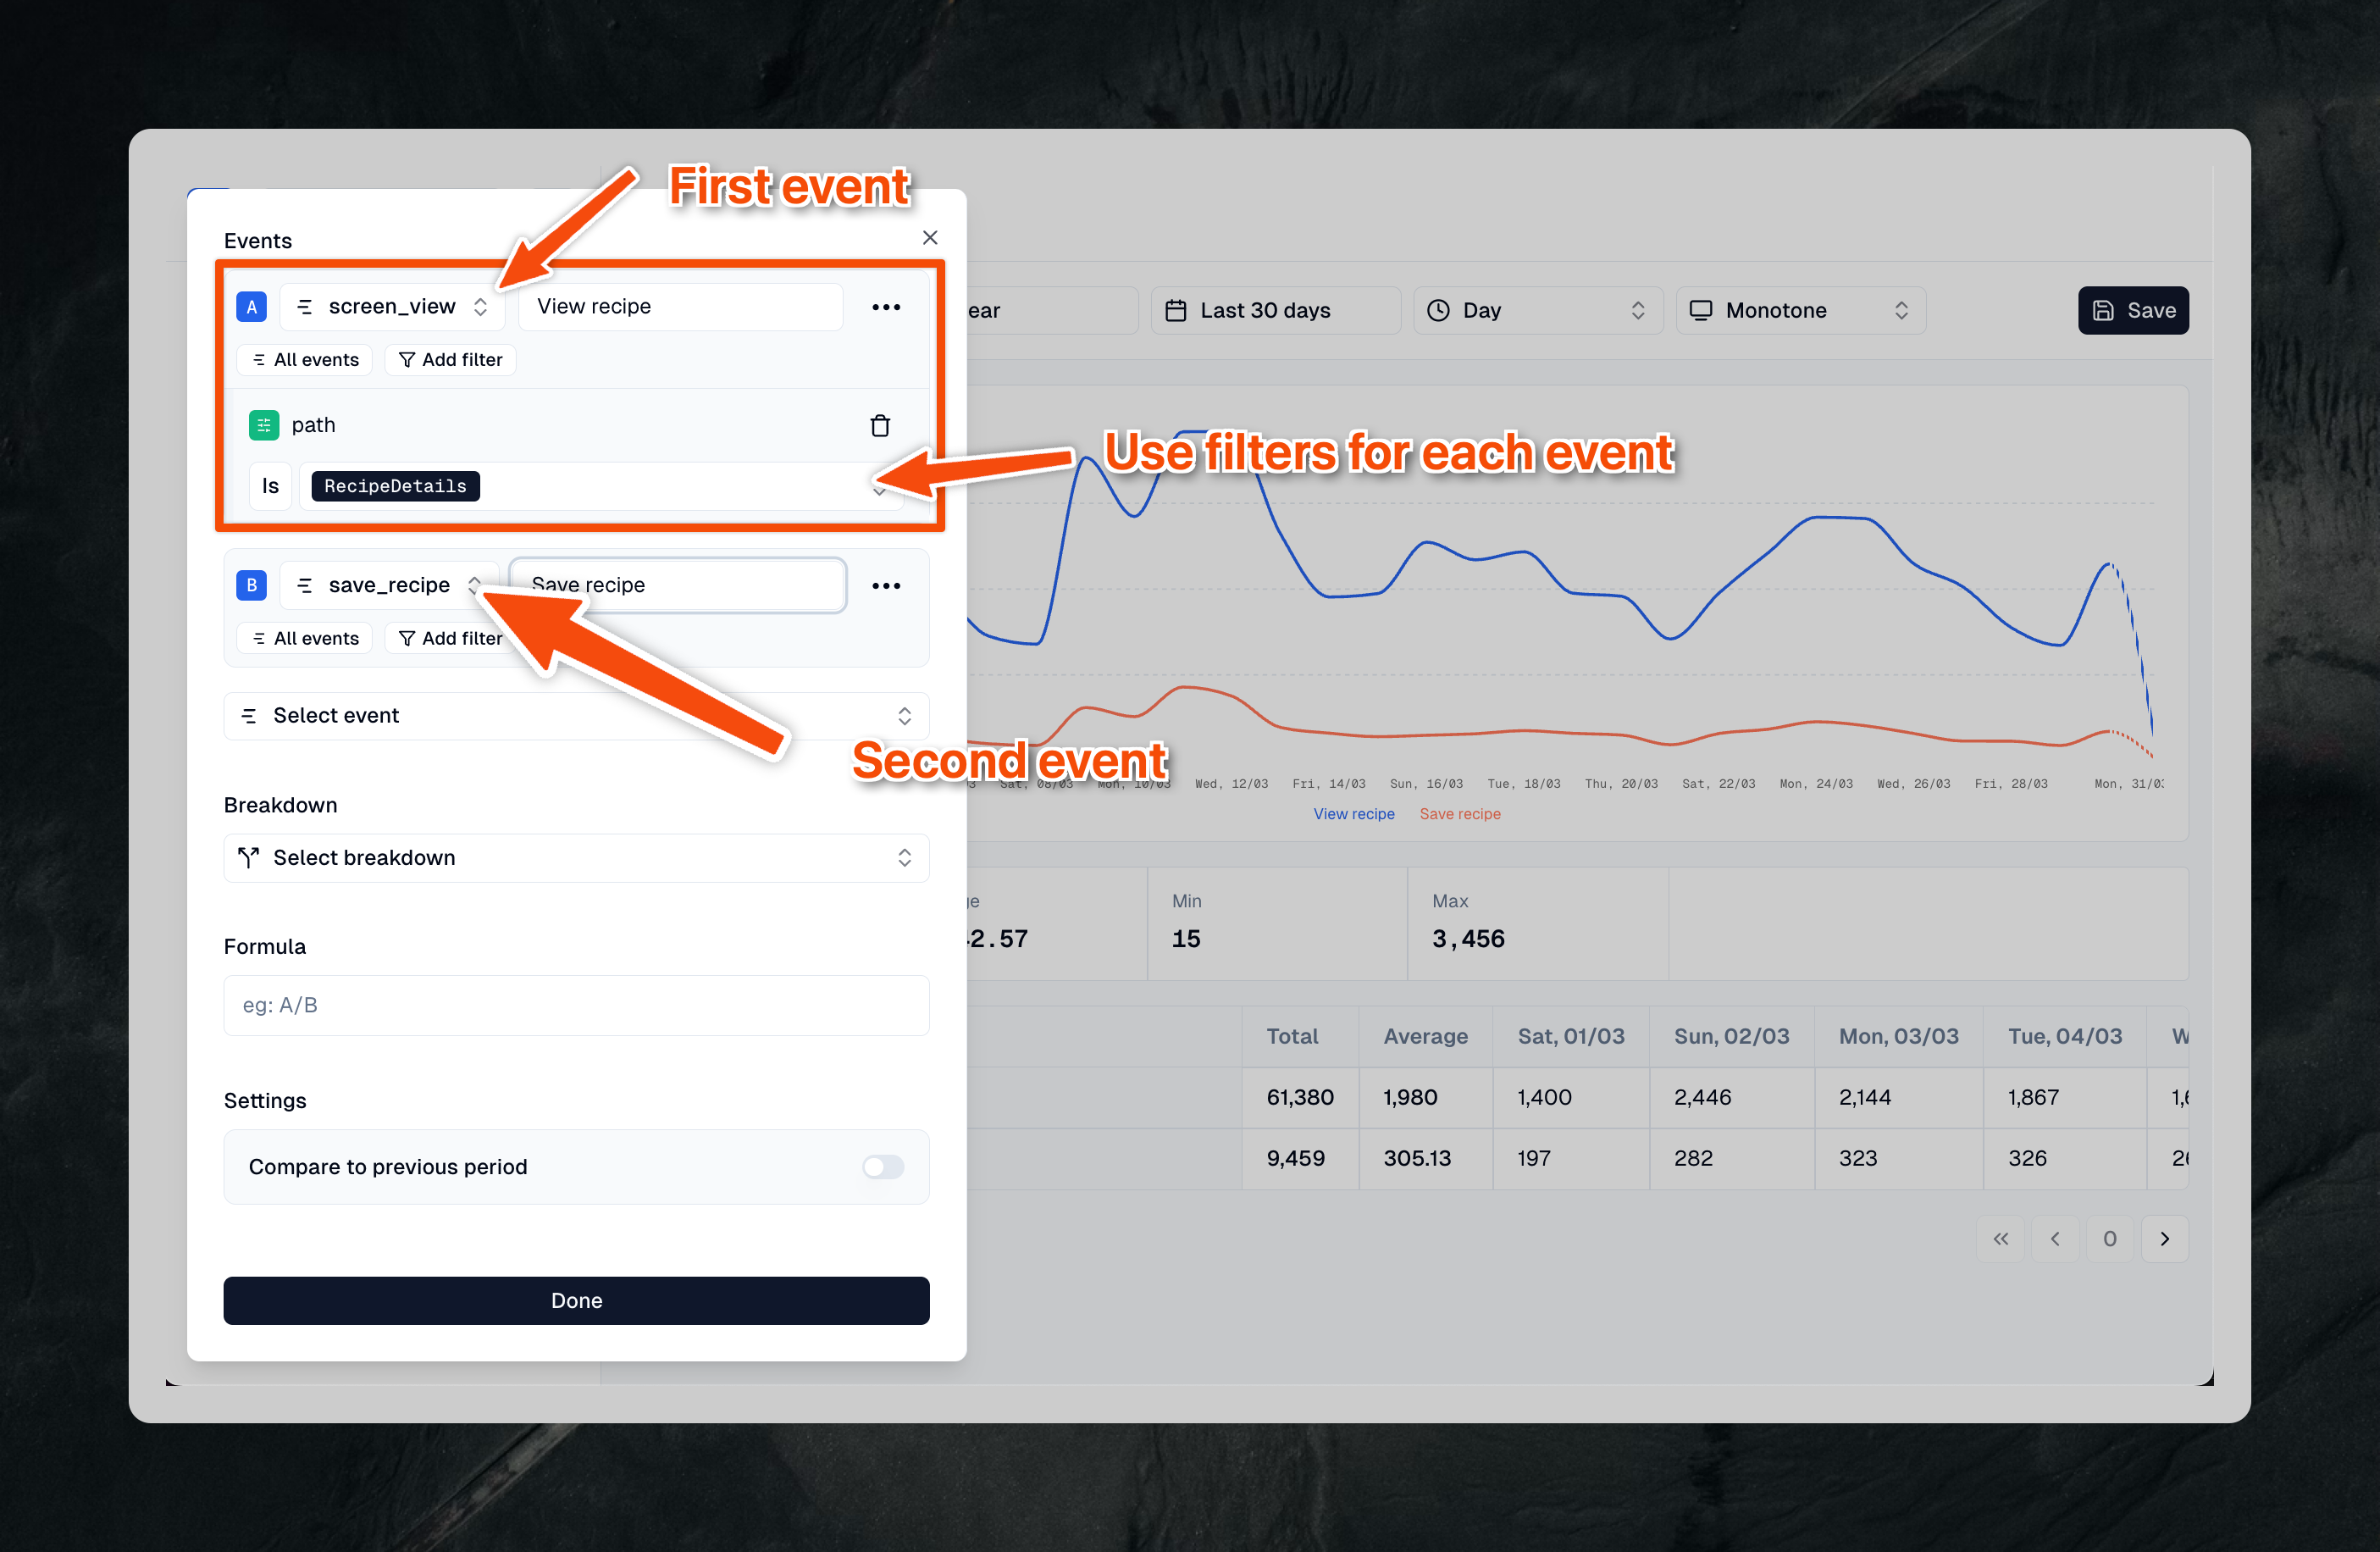
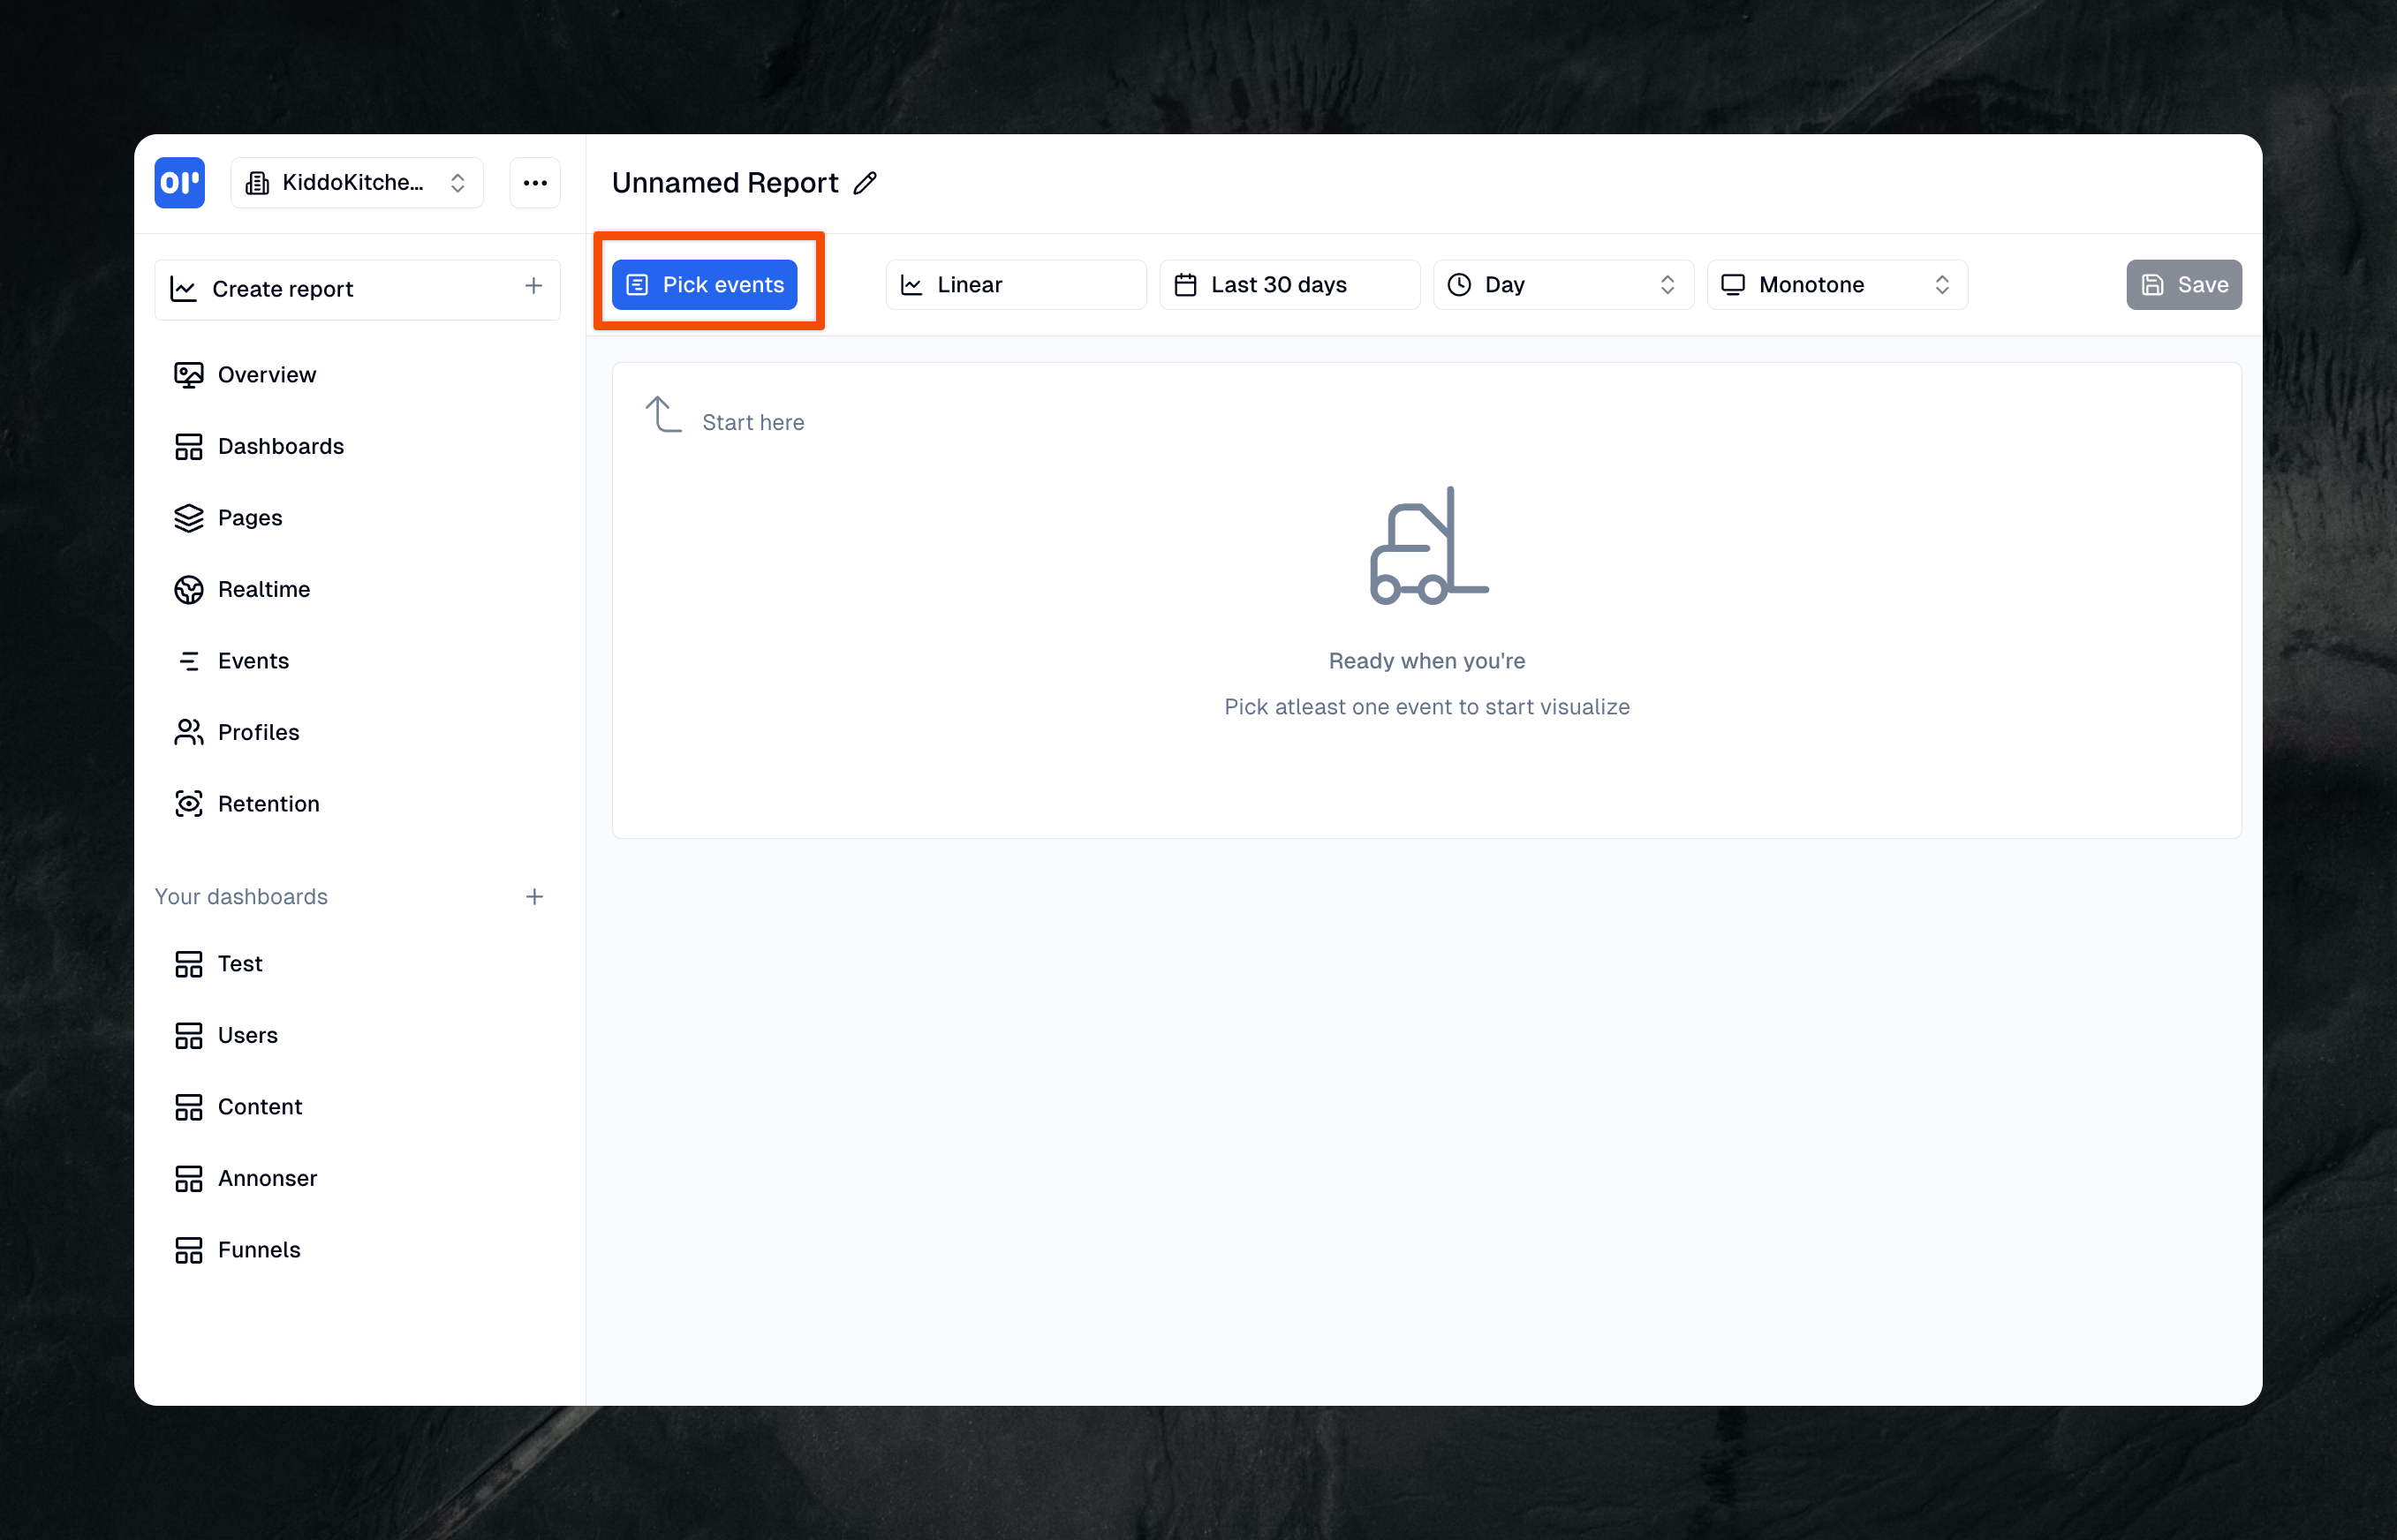
2. Pick events
Let's start with picking the events you want for your funnel. You can pick a screen_view event with a custom filter on (eg. path = /login) and than pick another events which is sign_up.
Our funnel will look like this:
- Pick all
screen_viewwhich haspath = /login - And than triggered
sign_up
3. Change report type
Before you change report type you'll see a linear chart with a line for each event you have picked, to get a funnel you can easily switch to Funnel (look at the image).
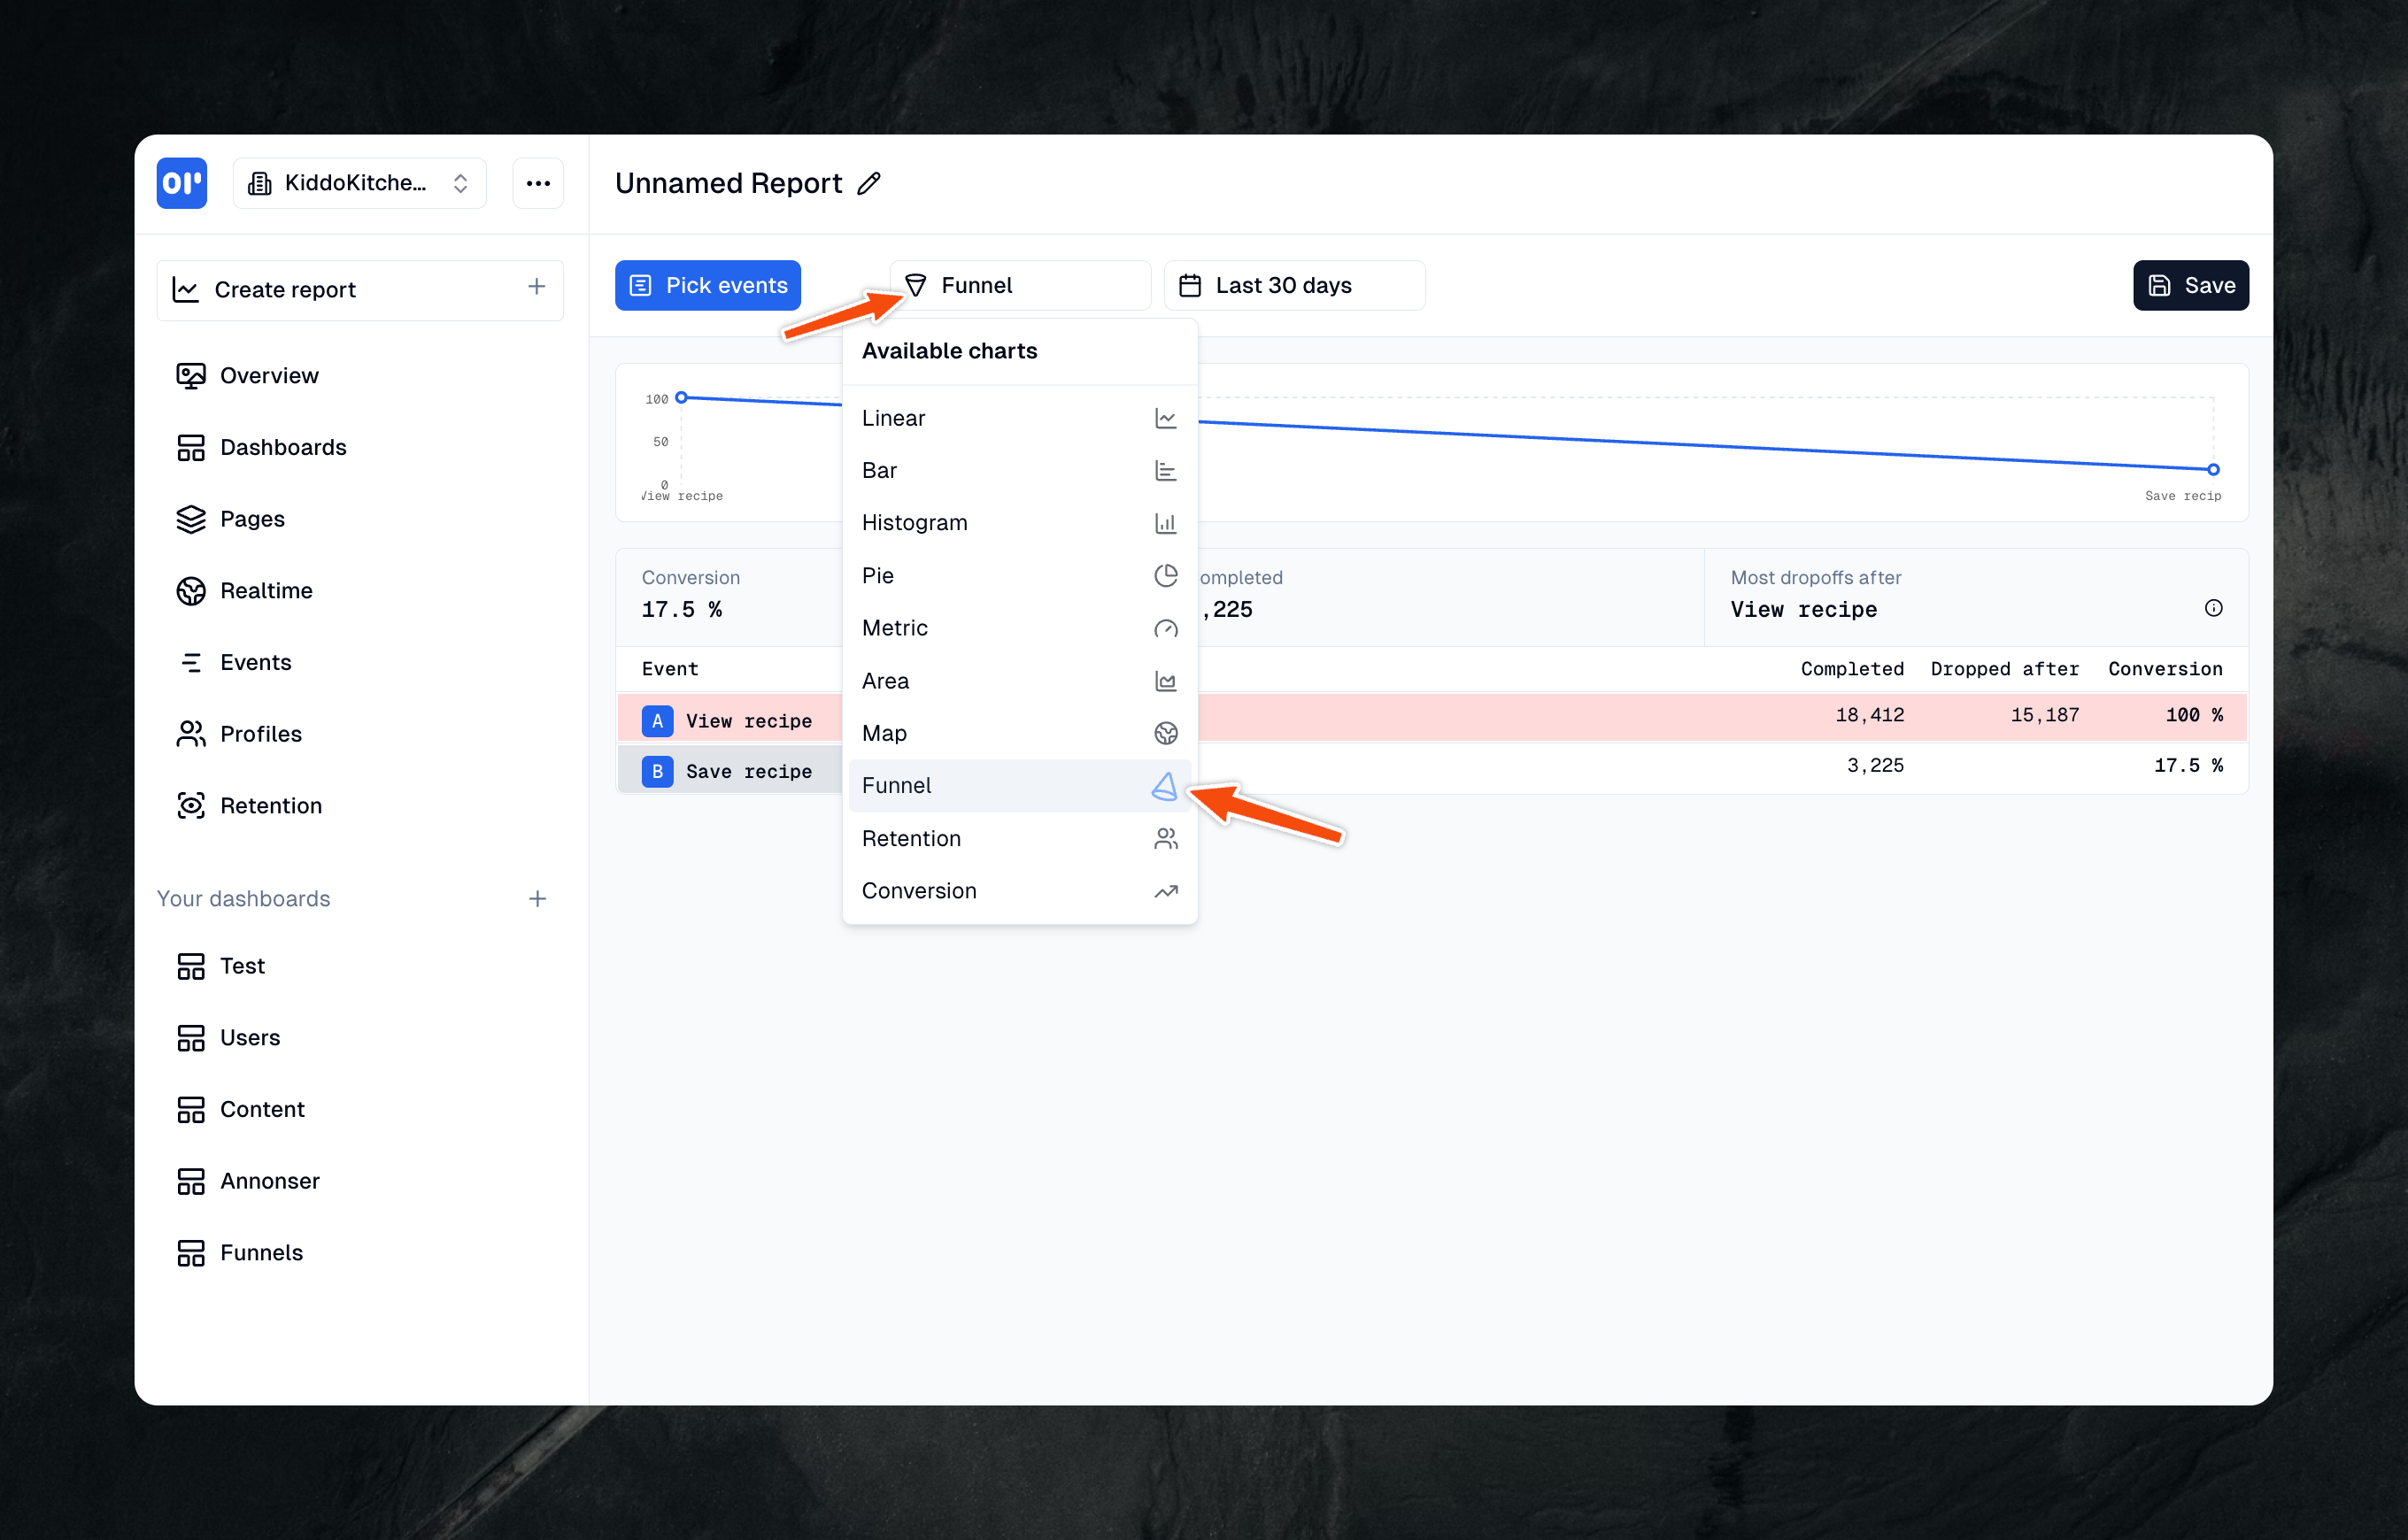
4. Understanding your funnel results
When your funnel is ready, you'll see a visualization. Say 1,000 people view a recipe - that's the top of your funnel. If 175 of them save the recipe, your conversion rate is 17.5%. That number tells you how well this part of your process is working.
In this example we just did a 2-step-funnel, you can have as many steps as you want, but we recommend around 3-5.
Making your funnel work better
Funnels help you improve your website or app. Start by looking for big drops between steps - these are your opportunities for improvement. In OpenPanel we mark which step could be improved most. If many people leave after viewing a recipe but before saving it, you might make the save button more visible or add features that make saving more appealing.
Keep your funnels simple at first. Track 2-4 important steps rather than everything at once. Check your funnel data regularly, perhaps weekly, and compare time periods to see if your changes are working.
Real-world funnel examples
Here are some common ways to use funnels. A recipe website might track the journey from viewing a recipe to cooking it. An online store would follow the path from viewing a product to completing a purchase. A signup process might track users from the homepage through confirming their email.
Pick the steps that matter most for your goals.
Tips for success
Start small and stay consistent. Begin with one simple funnel for your most important process. Check it regularly and look for patterns. When you change your website or app, watch how it affects your funnel metrics.
Every small improvement counts. Help a few more people complete each step, and those wins add up over time.
A/B testing
A/B testing your funnels lets you compare versions of your product and make data-driven decisions. OpenPanel does this with the Breakdown feature, which works like a GROUP BY in SQL - it splits your funnel data into groups for comparison.
Here's how it works:
- Create your funnel as normal
- Click on "Breakdown" in the settings
- Choose the property you want to compare (like 'version', 'variant', or 'experiment_group')
- View the results side by side
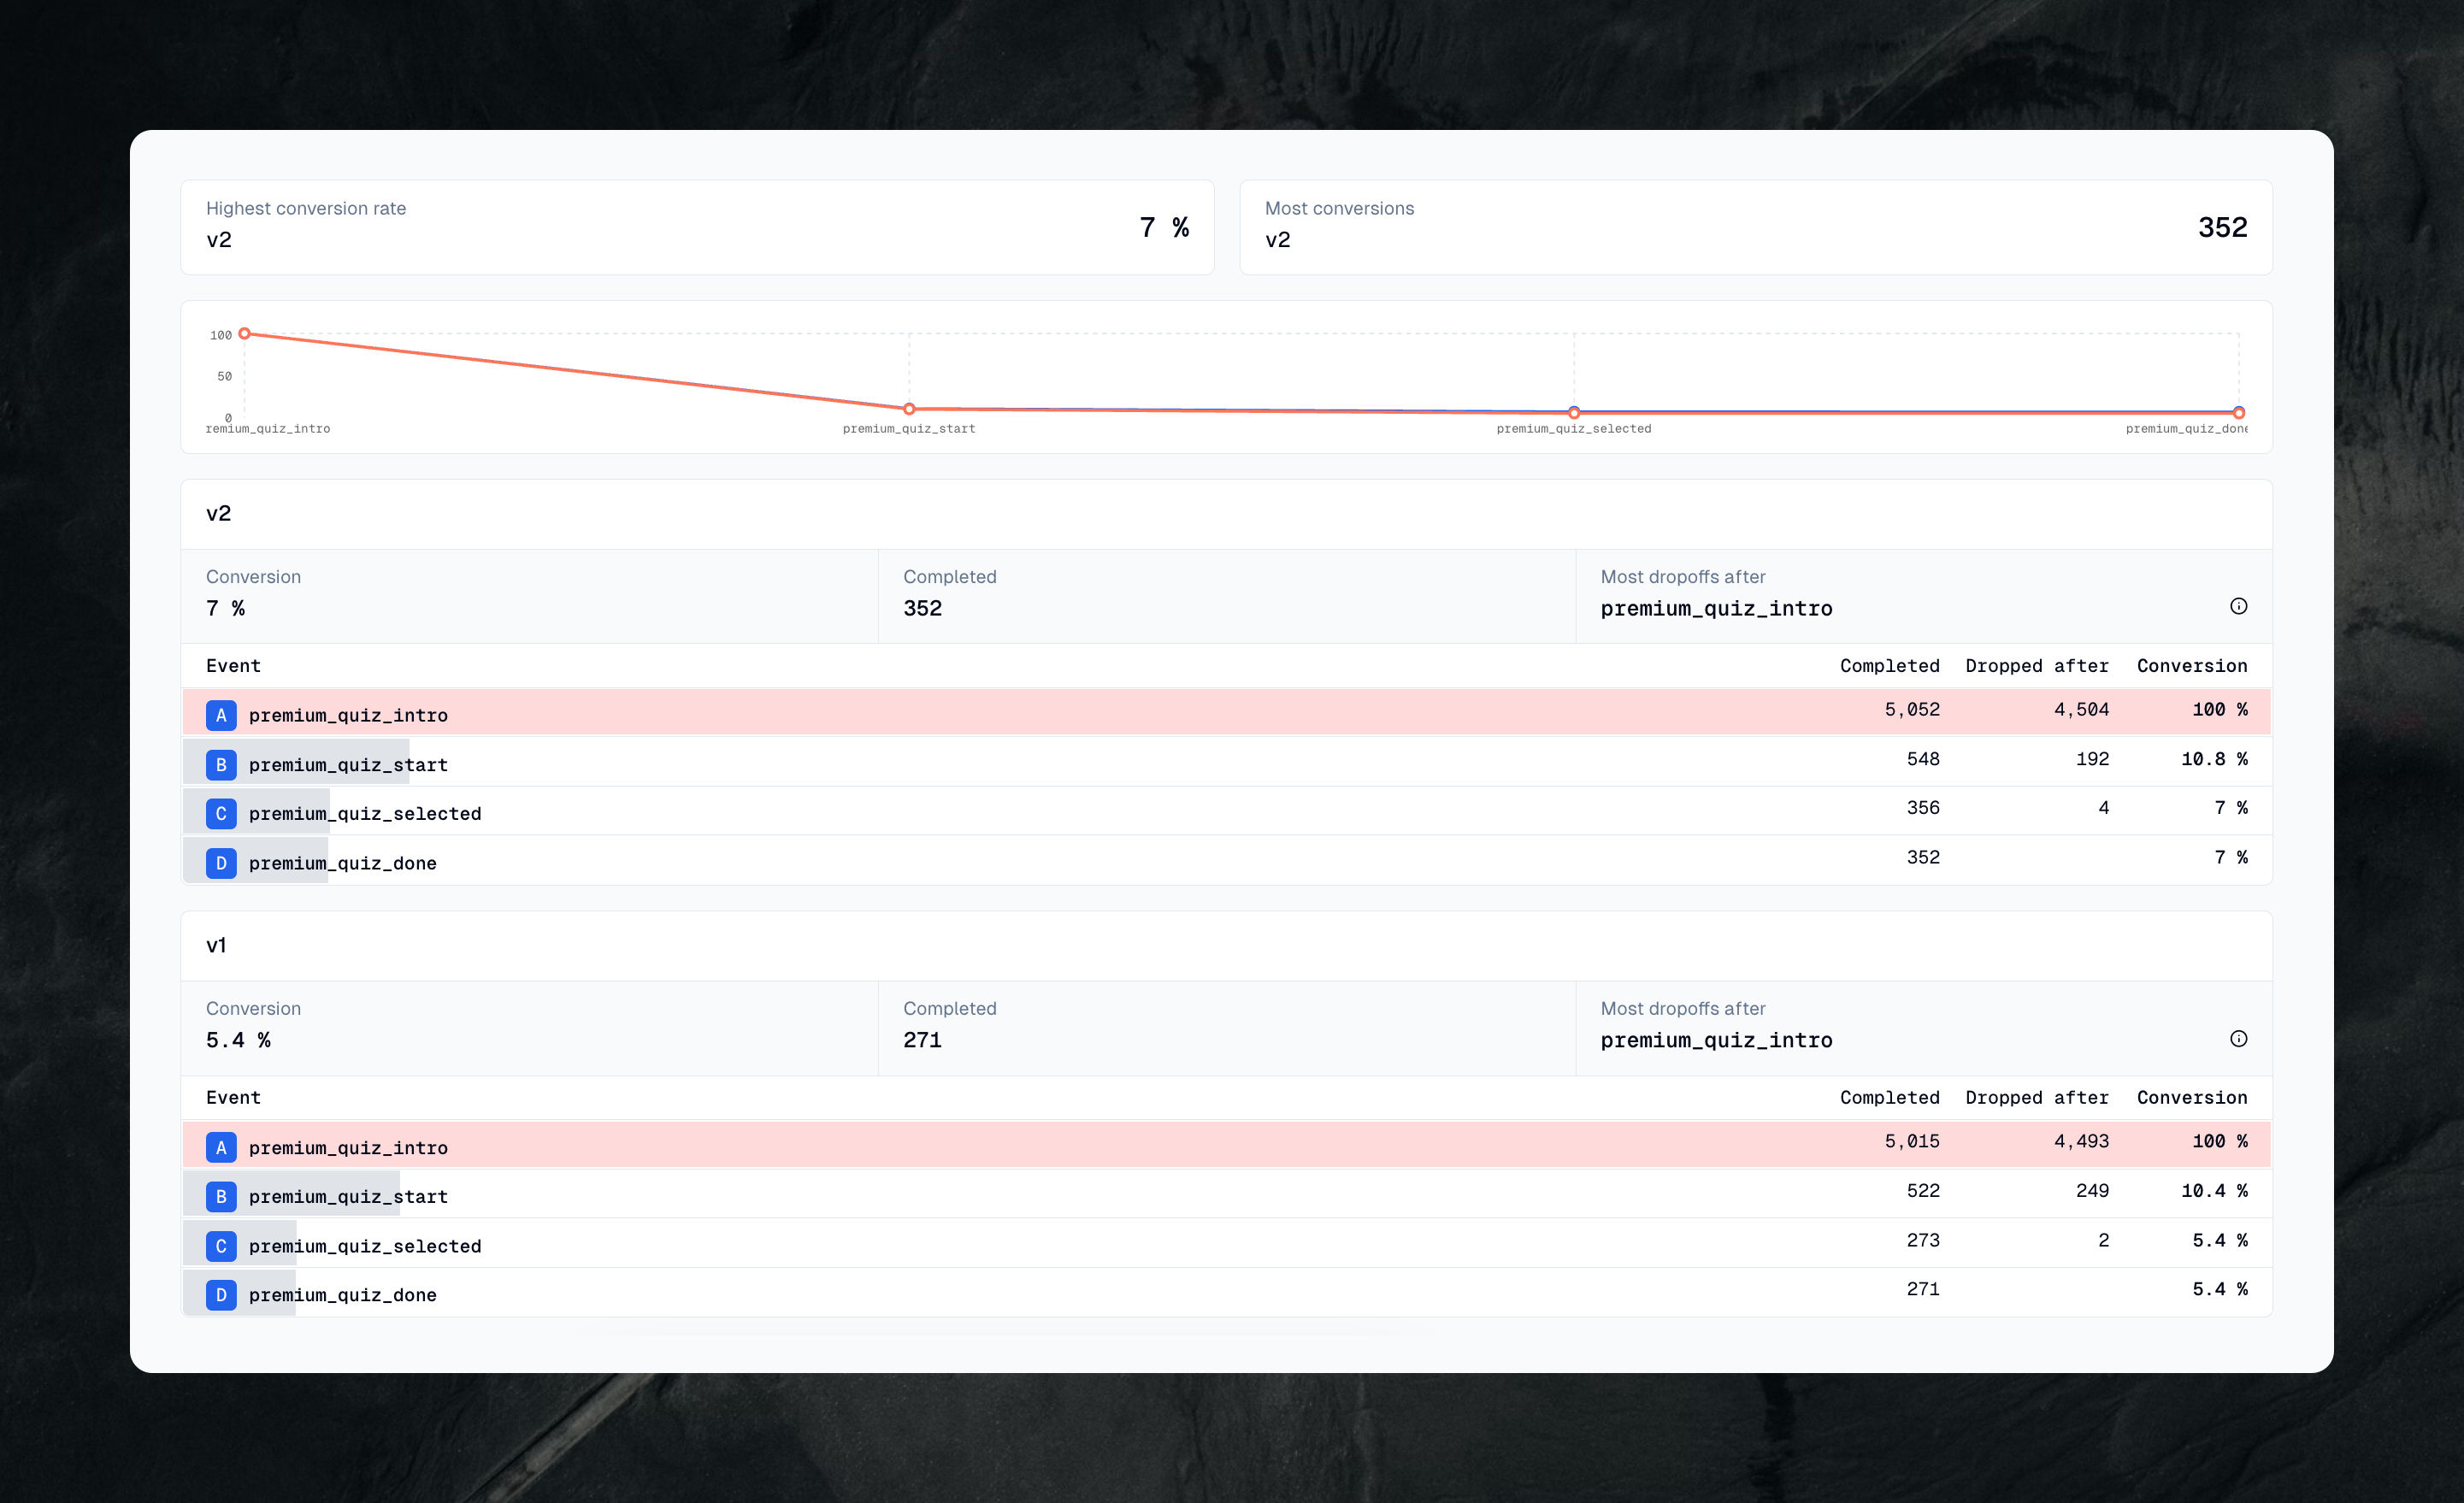
In the example below, we've broken down our funnel by a version property to compare two versions of our product. Version v2 shows a conversion rate of 7% compared to v1's 5.4% - that's a 29% improvement. This makes it much easier to:
- Validate new features
- Test different user interfaces
- Measure the impact of changes
- Make confident decisions about which version to keep
Run your tests long enough to get statistically significant results. A good rule of thumb is to wait until you have at least 1,000 users in each group before making major decisions based on the data.
Pro tip: you can use multiple breakdowns to segment further. For example, compare versions across countries or device types to check that your improvements work for everyone.
Build your first conversion funnel
You don't need a data team to build a conversion funnel. OpenPanel is an open-source, privacy-first analytics platform with funnels, retention, and event tracking built in — track the events that matter, switch the report type to Funnel, and you'll see exactly where users drop off. It's cookieless by default, so there's no consent banner to slow you down, and you can use the cloud or self-host it for free.
Related articles
 Guide
GuideWhat Is Cohort Analysis? A Practical Guide to Retention & Churn
OpenPanel Team · 2026-05-29
 Guide
GuideIs Mixpanel Worth It in 2026? Real Costs at 1M, 10M & 20M Events
OpenPanel Team · 2025-12-08
 Guide
GuideHow to Export Data from Umami Analytics
OpenPanel Team · 2025-10-30
 Guide
GuideCookieless Analytics: Best Tools & How They Work in 2026
OpenPanel Team · 2025-06-17
 Guide
GuideHow to Self-Host OpenPanel Analytics Platform
OpenPanel Team · 2025-02-28
 Guide
GuideSelf-Hosted Analytics Without DPAs: GDPR, HIPAA, CCPA Guide
OpenPanel Team · 2024-12-08