10 Best Product Analytics Tools in 2026, Compared
10 best product analytics tools in 2026, compared on price, free tiers, session replay and self-hosting: Mixpanel, Amplitude, PostHog, OpenPanel and more.
Product analytics tracks what people do inside your product: which features they use, where a signup flow loses them, and whether they come back next week. Web analytics tracks traffic to your site: pageviews, referrers, countries and devices. The first answers "why did activation drop", the second "where did visitors come from".
This guide compares 10 product analytics tools on what decides a purchase: pricing model, free tier, session replay, self-hosting, and how deep the funnel, retention and cohort reports go. It is written for product managers and engineers at startups and mid-size companies. We build OpenPanel, so it is listed first, and we say where Mixpanel, Amplitude or PostHog is the better choice. If you already run Mixpanel and want out, read Mixpanel alternatives instead; for the tools you can run on your own servers only, see self-hosted product analytics.
Quick comparison
| Tool | Open source | Self-host | Free tier | Paid from | Session replay | Best for |
|---|---|---|---|---|---|---|
| OpenPanel | AGPL-3.0 | Yes, Docker Compose | No, 30-day trial | $2.50/mo (5K events) | Included, 30-day retention | Web + product analytics on one 3.3 KB script |
| Mixpanel | No | No | 1M events/mo | $100/mo (1.5M events, yearly billing) | 10K/mo on Free, 20K on Growth | Deepest self-serve analysis |
| Amplitude | No | No | 2M events/mo | Plus scales with events, no published price | 10K sessions/mo | Enterprise governance and experiments |
| PostHog | MIT | Hobby deploy, unsupported | 1M events/mo | $0.00005 per event after 1M | 5K recordings free, then $0.005 each | Flags, replay and SQL for engineers |
| Heap | No | No | 10K sessions/mo | Quote | Yes | Autocapture and retroactive analysis |
| Pendo | No | No | 500 MAU | Quote | Add-on on Base, included from Core | Analytics plus in-app guides |
| Countly | AGPL-3.0, modified | Yes, Lite is non-commercial | Lite, self-hosted | $175/mo (Flex) | No | Mobile apps with crash reports and push |
| Fullstory | No | No | 30K sessions/mo | Quote | Core of the product | Replay-first UX research |
| Google Analytics 4 | No | No | Free, sampled | GA4 360, custom via resellers | No | Google Ads attribution |
| Matomo | GPL-3.0 | Yes, PHP + MySQL | Self-hosted free | Cloud 29/mo (50K hits); plugins from 94 EUR/yr | Paid plugin, 219 EUR/yr | Google Analytics replacement with data ownership |
Prices checked November 2026. Each section links the vendor page we read.
How to choose a product analytics tool
Event model and SDKs
Manual tracking (Mixpanel, Amplitude, OpenPanel, PostHog by default) means you call track('checkout_completed', { value: 99 }) in code: clean event names, only the data you asked for. Autocapture (Heap, Fullstory, Pendo, PostHog optionally) records every click and page view and lets you define events afterwards, at the cost of noisy names and roughly 10 times the data. Check SDK coverage first: a tool without a React Native or Swift SDK is the wrong pick for a mobile app.
Funnels, retention and cohorts
Every tool here has a funnel report. The differences are conversion windows, breakdowns by property, and cohorts built from behavior ("did X but not Y in 30 days") that you can reuse in a retention chart. Mixpanel and Amplitude go deepest. GA4 and Matomo are the shallowest, and Matomo charges for the funnel report.
Pricing model: events, users or sessions
Event pricing (Mixpanel, Amplitude, PostHog, OpenPanel) grows with how much you track. Monthly active user pricing (Pendo, Countly) grows with your audience, which punishes consumer apps with many light users. Session pricing (Heap, Fullstory, Matomo's hits) grows with visits. Run your own numbers: 50,000 users doing 100 events each is 5M events a month, which is $250 on OpenPanel, about $153 on PostHog for analytics alone, and $438 on Mixpanel Growth with yearly billing.
Privacy and data location
Where is the data stored (US, EU, or your servers)? Does the script set cookies, which decides whether EU visitors need a consent banner? Can you delete one user on request? OpenPanel is cookie-free and EU-hosted, Mixpanel and Amplitude offer EU residency as an option, and GA4 processes in the US and needs consent mode in the EU.
Session replay and self-hosting
Replay is part of most analytics tools now; the question is whether it is included or metered. OpenPanel includes it, Mixpanel and Amplitude include 10,000 replays a month on their free plans, PostHog bills per recording after 5,000, and Pendo sells it as an add-on on Base. Self-hosting is rarer: only OpenPanel, PostHog, Countly and Matomo run on your servers. PostHog calls its self-hosted deploy officially unsupported, Countly Lite is non-commercial, Matomo's funnels and replay are paid plugins even on-premise, and OpenPanel's self-hosted release trails Cloud by one to two months.
How much of the platform you will use
PostHog, Pendo, Amplitude and Mixpanel bundle feature flags, experiments, guides or surveys with the analytics. Good value if you will use three of them; complexity and script weight if you want analytics only.
OpenPanel
Best for: teams that want web and product analytics from one small script, with session replay included and EU hosting or self-hosting.
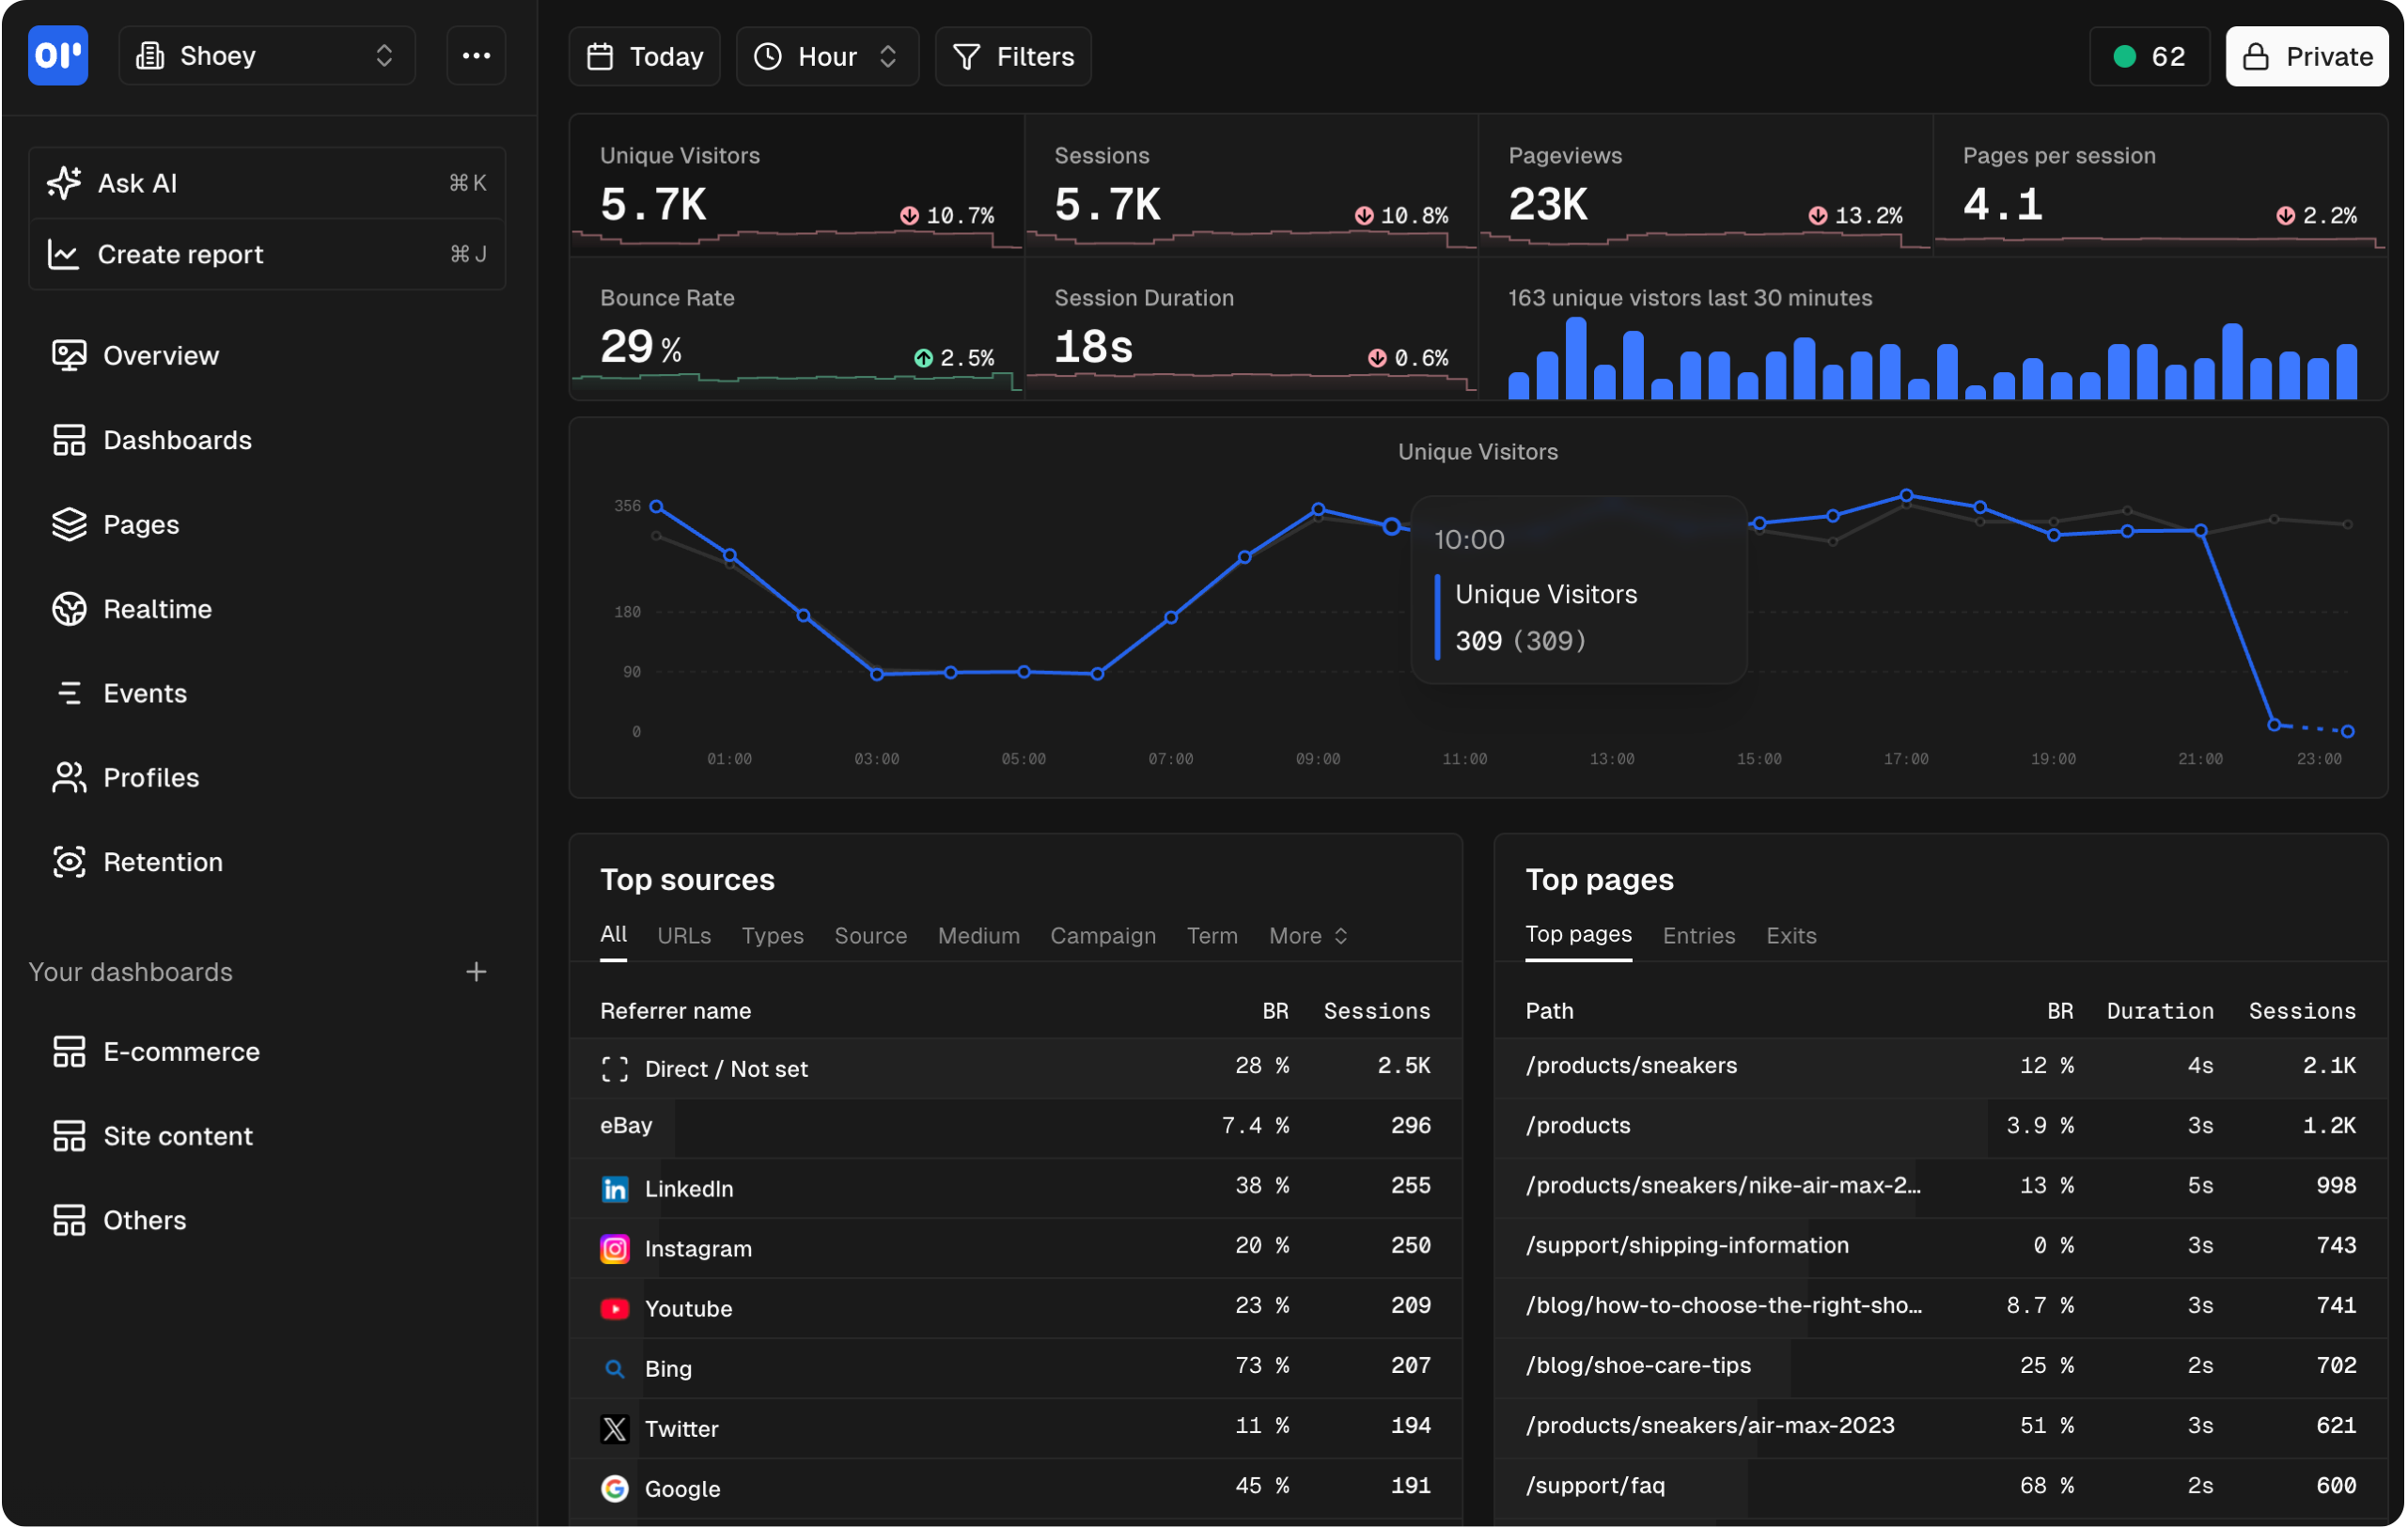
OpenPanel is open source (AGPL-3.0) web and product analytics. One 3.3 KB script gives you the traffic dashboard you would get from Plausible and the funnels, retention and user profiles you would get from Mixpanel. Tracking is cookie-free by default, so EU sites do not need a consent banner for it, and Cloud data stays in the EU.
Key features
- Funnels, retention and cohorts with property breakdowns, including A/B variant breakdowns
- User profiles with a full event timeline per person
- Session replay on every plan, 30-day retention
- Revenue tracking and an MCP server for Claude, Cursor or ChatGPT
- SDKs for web, React, Next.js, Vue, React Native, Swift, Kotlin, Python and more
Pricing
No free Cloud plan; you get a 30-day trial. Flat tiers by event volume: $2.50 a month for 5,000 events, $20 for 100,000, $30 for 250,000, $90 for 1M and $350 for 10M. Replay, seats and projects are not metered. Self-hosting is free: a Docker Compose stack (ClickHouse, Postgres, Redis) with a one-command setup script. All tiers are on the pricing page.
Pros
- Flat, predictable bill with replay and seats included
- 3.3 KB script, cookie-free, EU hosting
- Self-host the full product for free, or move between Cloud and self-hosted
Cons
- No free Cloud plan, where Mixpanel and PostHog give you 1M events
- No feature flags, surveys, heatmaps or SQL editor
- Self-hosted releases land one to two months after Cloud
Start a 30-day Cloud trial and see funnels, retention and session replay on real data. No credit card, no cookie banner, and the same product is free to self-host.
Mixpanel
Best for: product teams that want the deepest self-serve analysis and either stay under 1M events a month or will pay for volume.
Mixpanel has defined event-based product analytics since 2009. Its report builder (Insights, Funnels, Flows, Retention) lets a product manager answer a new question in minutes without SQL. Cookies and US data residency are the defaults, with an EU option.
Key features
- Insights, Funnels, Flows and Retention reports with breakdowns, formulas and saved cohorts
- Session replay on web and mobile, 10,000 replays a month on Free
- Feature flags and experiments (10 active flags on Free, 50 on Growth)
- SDKs for web, iOS, Android, React Native, Flutter, Unity and server languages
Pricing
Free: 1M events a month, 10,000 replays, 5 saved reports per seat, 2 years of data history. Growth: the first 1M events are also $0, then $100 a month for 1.5M events on yearly billing ($140 monthly), $438 for 5M, $840 for 10M and $1,635 for 20M; above that you talk to sales. Group Analytics and Data Pipelines cost extra. Enterprise is custom. Source: mixpanel.com/pricing; see also our Mixpanel pricing breakdown.
Pros
- Deepest ad-hoc analysis in this list
- 1M free events a month with replays and flags on the same plan
- Mature SDKs and a large integration catalogue
Cons
- Costs climb fast past 1M events: 10M is $840 a month on yearly billing, against $350 on OpenPanel or about $324 on PostHog
- Cookies by default and 5 saved reports per seat on Free
- No self-hosting
Compare: OpenPanel as a Mixpanel alternative
Amplitude
Best for: larger organizations that need data governance, experimentation at scale and the biggest free tier of the proprietary tools.
Amplitude is Mixpanel's closest rival and leans enterprise: taxonomy management, a CDP, experimentation and AI summaries are part of the product. Its Free and Plus plans are now priced on events rather than monthly tracked users, and the Free plan carries 2M events a month.
Key features
- Charts, funnels, retention, journeys and behavioral cohorts (20 per organization on Plus)
- Session replay, 10,000 sessions a month on Free and Plus, 1-month retention
- Feature flags, one active experiment, and heatmaps on Plus and above
- Data governance and a warehouse-native option on Growth and Enterprise
Pricing
Free: 2M events a month, 1 year of data access, 10 saved charts, unlimited seats. Plus: starts at $0 with the first 2M events free, then scales with volume up to 70M events (or 700K MTUs), with 2 years of data, custom events and formulas. Growth and Enterprise are quote-based and include 20,000 and 50,000 replay sessions. Amplitude does not publish per-event prices for Plus; it points you to a bill estimator. Source: amplitude.com/pricing.
Pros
- 2M free events a month, no credit card
- Strongest governance and experimentation of the analytics-first tools
- EU data center in Frankfurt available
Cons
- No published price above 2M events; Growth and Enterprise are sales-led
- Free plan has no behavioral cohorts and only 10 saved charts
- First-party cookies, so a consent banner in the EU; no self-hosting
Compare: Amplitude vs OpenPanel
PostHog
Best for: engineering-led teams that want analytics, replay, feature flags, experiments and SQL in one product and accept metered pricing.
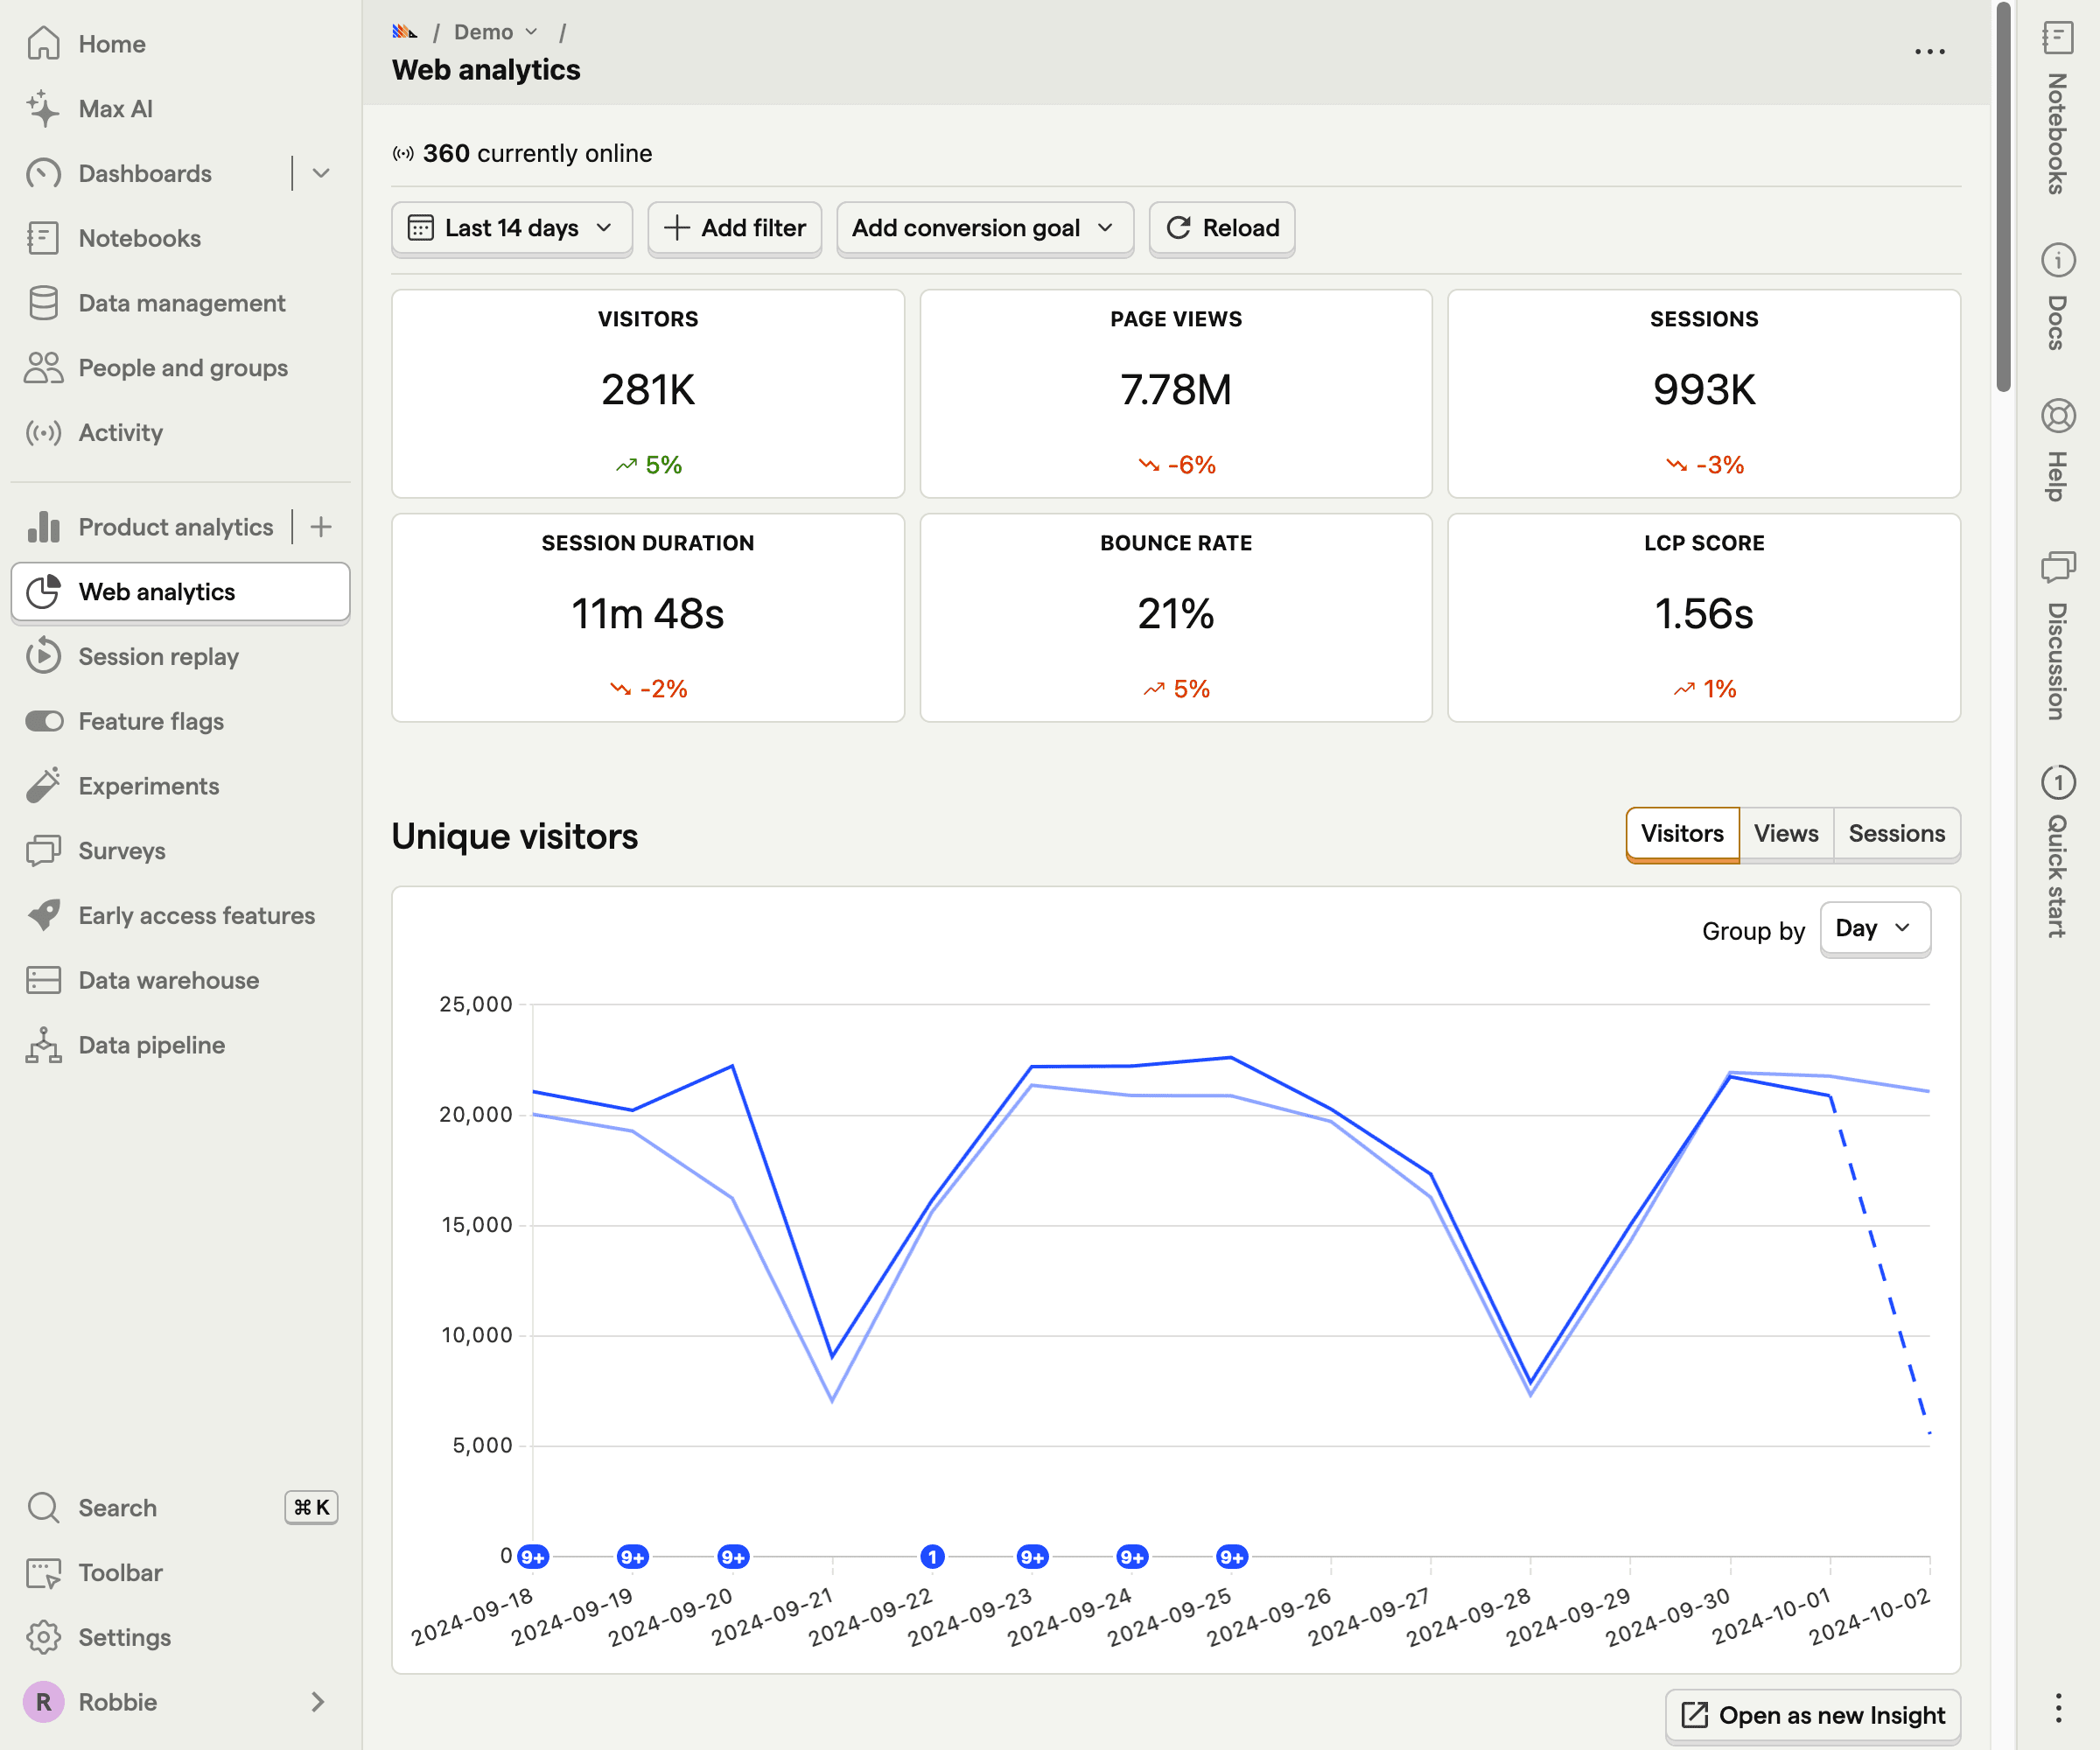
PostHog is open source (MIT) and ships product analytics, web analytics, session replay, feature flags, experiments, surveys, error tracking and a data warehouse on one event store. HogQL lets you write SQL against your events inside the dashboard. The cost is weight: the browser bundle was about 105 KB gzipped when we measured posthog-js 1.438 in October 2026, against 3.3 KB for OpenPanel.
Key features
- Funnels, trends, retention, paths, lifecycle and stickiness reports
- HogQL (SQL) queries and a data warehouse for joining outside sources
- Session replay with console and network logs
- Feature flags, experiments with significance testing, surveys, error tracking
Pricing
Every product has its own free allowance and meter. Analytics: 1M events a month free, then $0.00005 per event to 2M and $0.0000343 from 2M to 15M, so 10M events is about $324. Replay: 5,000 recordings free, then $0.005 each. Flags: 1M requests free, then $0.0001. Surveys: 1,500 responses free. Error tracking: 100,000 exceptions free. Platform packages for SSO, permissions and support are Boost at $250 a month, Scale at $750 and Enterprise at $2,000. Source: posthog.com/pricing.
Pros
- 1M analytics events a month free, with replay, flags and surveys on the same account
- SQL access and the widest feature set in this list
- MIT license, cloud in the US or EU
Cons
- Six meters make the bill hard to predict once you use more than analytics
- Self-hosting is a hobby Docker Compose deploy that PostHog calls officially unsupported; it asks for 4 vCPU and 16 GB RAM and steers you to Cloud above roughly 300,000 events a month
- Heavy script, with localStorage and a first-party cookie by default
Compare: PostHog vs OpenPanel
Heap
Best for: teams that want every click captured automatically so they can define events after the fact.
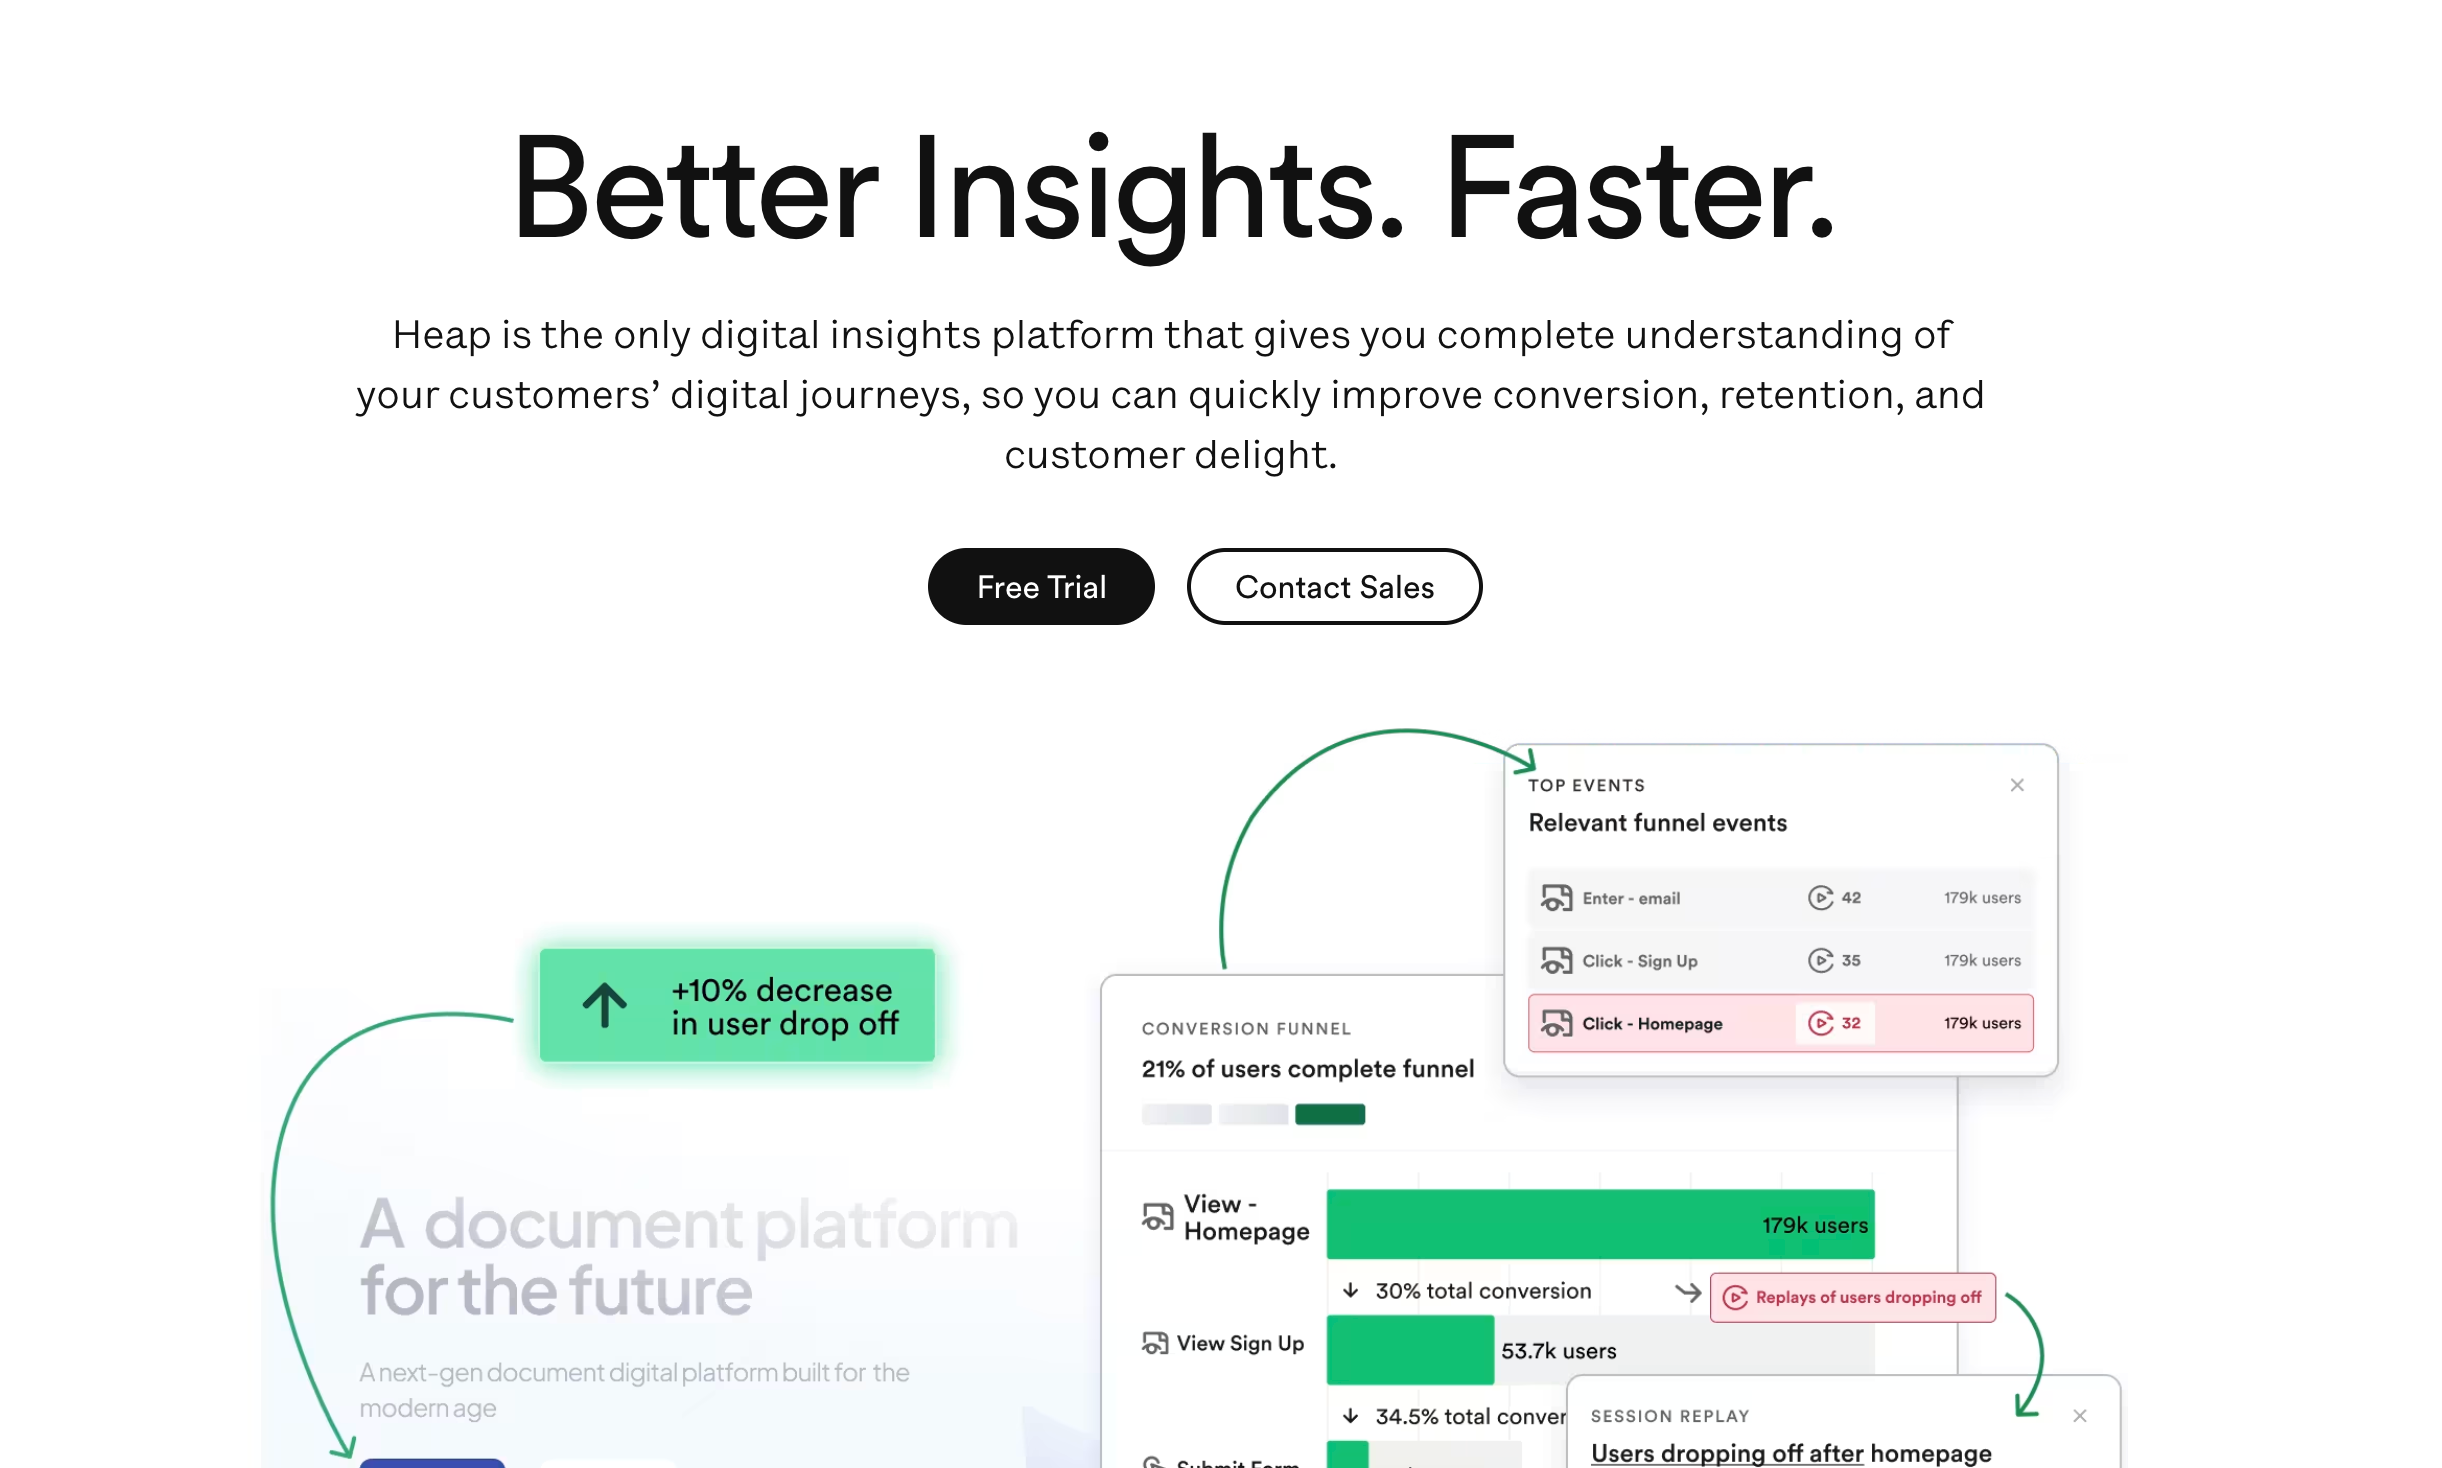
Heap, now part of Contentsquare, popularized autocapture: install the snippet once and it records every click, form submission and page view, then you name events retroactively by pointing at elements. On paid plans the analytics and replay are tied to Contentsquare's Sense AI for surfacing friction.
Key features
- Autocapture with visual event definition and retroactive analysis
- Funnels, retention, paths and user profiles
- Session replay and heatmaps
- Web, iOS, Android and React Native SDKs
Pricing
Free: up to 10,000 sessions a month, 6 months of data retention. Growth: install the snippet and Heap gives a volume-based estimate; 12 months of retention. Pro and Premier: custom session pricing, 1 year of retention with paid extra years. No dollar amounts are published. Source: heap.io/pricing.
Pros
- Nothing to instrument before you get data
- Non-engineers can define events retroactively
- Replay and heatmaps in the same tool
Cons
- No public paid pricing; session-based plans need a sales quote
- Autocapture stores far more data than you use and can record sensitive fields unless masked
- No self-hosting and no open source
Compare: Heap vs OpenPanel
Pendo
Best for: product teams that want to act on analytics inside the app with guides, tooltips and NPS, not only measure it.
Pendo pairs product analytics with in-app guides, NPS and feedback. You can find the users who dropped out of a funnel and show them a walkthrough from the same screen. Its analytics use retroactive tagging similar to Heap's autocapture, and pricing is by monthly active users.
Key features
- Paths, funnels, retention and feature adoption with retroactive tagging
- No-code in-app guides, tooltips and walkthroughs
- NPS, PMF and CSAT surveys (Pendo-branded on Free)
- Session replay, an add-on on Base and included from Core
Pricing
Free: up to 500 MAUs with unlimited app keys, analytics, guides and Pendo-branded NPS; past 500 MAUs you can no longer create guides, surveys or segments. Base (analytics and guides), Core (adds replay) and Ultimate (adds sentiment, orchestration, Listen and Data Sync) are "request pricing". No prices are published. Source: pendo.io/pricing.
Pros
- Guides and surveys let you act on what the analytics found
- Onboarding changes without engineering time
- The free plan covers an early B2B product under 500 MAUs
Cons
- MAU pricing gets expensive for consumer apps with many light users
- Analytics are shallower than Mixpanel or Amplitude for ad-hoc questions
- Sales-led pricing and no self-hosting
Countly
Best for: mobile-first teams that want analytics, crash reporting and push notifications on their own servers.
Countly started as mobile analytics in 2012 and still fits mobile apps best: crash analytics with symbolication, push notifications and remote config sit next to funnels and user profiles. It runs on Node.js and MongoDB in three editions: Lite (self-hosted, free), Flex (hosted private cloud) and Enterprise (self-hosted, paid).
Key features
- Sessions, events, funnels, retention and user profiles
- Crash and error reporting with symbolication
- Push notifications and remote config
- SDKs for iOS, Android, Flutter, React Native, web and server
Pricing
Lite is free to self-host under AGPL-3.0 with a modified Section 7; Countly describes it as a non-commercial license, so a business needs Flex or Enterprise. Flex starts at $175 a month, priced on monthly active users and data points, with a 14-day trial that requires a credit card. Enterprise is custom and billed annually. Source: countly.com/pricing.
Pros
- Analytics, crash reports and push in one self-hosted tool
- Wide mobile SDK coverage
- Enterprise edition runs fully on-premise with no vendor access to data
Cons
- Lite's license rules out commercial use, and paid plans start at $175 a month
- No session replay
- MongoDB and Node.js are heavier to run than a Docker Compose stack
Compare: Countly vs OpenPanel
Fullstory
Best for: UX and research teams that start from session replay and want product analytics on top of it.
Fullstory is replay-first: autocapture records every session for pixel-accurate replay, then funnels, conversion analysis, heatmaps and frustration signals (rage clicks, dead clicks) run on the captured data. A note for anyone comparing replay tools: Smartlook, a common alternative, stopped selling paid plans on 31 May 2026 and shuts down on 30 September 2027 following its acquisition by Cisco, which leaves Fullstory and PostHog as the main replay-first picks.
Key features
- Session replay with console and network inspection
- Autocaptured events with retroactive definitions
- Funnels, conversion analysis and dashboards
- Scroll, click and conversion heatmaps
Pricing
Fullstory Free: 30,000 sessions a month, 12 months of analytics retention, up to 10 users, no credit card. Business, Advanced and Enterprise are "request pricing"; Dashboards and StoryAI need a paid plan, and Mobile, StoryAI and Guides and Surveys are add-ons. No prices are published. Source: fullstory.com/pricing.
Pros
- Replay fidelity and frustration detection are the best here
- 30,000 free sessions a month is the largest free replay allowance in this list
- Mature enterprise security and export options
Cons
- Paid plans are sales-led and aimed at enterprise budgets
- Analytics come second to replay; cohorts and retention are thinner than Mixpanel's
- Session pricing penalizes high-traffic sites, and there is no self-hosting
Compare: Fullstory vs OpenPanel
Google Analytics 4
Best for: marketing teams that need attribution tied to Google Ads and Search Console and can live with sampling and US processing.
GA4 is event-based, free, and already installed on most sites. It can run funnel, path and cohort explorations, but it is a marketing tool first: user-level analysis is limited, explorations are sampled past 10M events per query on standard properties, and the data model is built around ad attribution.
Key features
- Event-based model with up to 25 parameters per event
- Funnel, path, cohort and free-form explorations
- BigQuery export, 1M events a day on standard properties
- Google Ads, Search Console and Merchant Center integration
Pricing
Standard GA4 is free. Its limits: user-level data retention of 2 or 14 months, explorations sampled past 10M events per query, 50 event-scoped custom dimensions. Analytics 360 raises those to 50 months, 1B events per query and 125 dimensions, with billions of daily BigQuery events. Google does not publish the 360 price; it is sold through sales and certified resellers. Sources: GA4 360 comparison, data retention.
Pros
- Free at a volume no other tool here matches
- Deep Google Ads and Search Console attribution
- BigQuery export for your own SQL
Cons
- Sampling in explorations and 14-month retention make long-range product analysis unreliable
- Cookies and US processing; EU sites need consent mode, and several EU regulators have ruled against its default setup
- No user profiles or replay
Compare: Google Analytics vs OpenPanel
Matomo
Best for: organizations replacing Google Analytics that want full data ownership and can pay for product features as plugins.
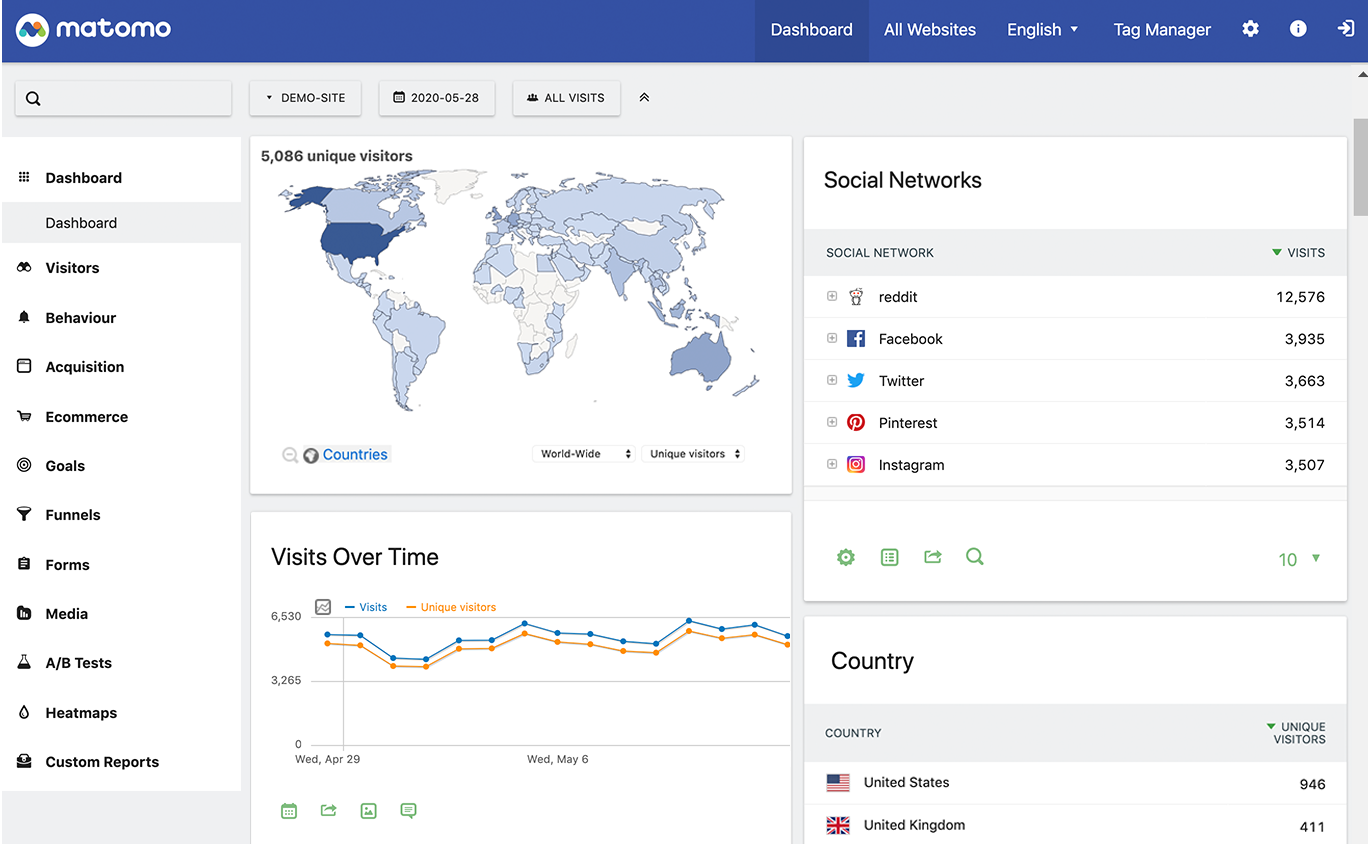
Matomo (formerly Piwik) is the most mature open-source web analytics tool, used by governments and universities for GDPR reasons. Its product analytics are plugins: Funnels, Cohorts, Users Flow, Heatmap & Session Recording and A/B Testing are each yearly subscriptions, even when you self-host.
Key features
- Full web analytics: pages, referrers, campaigns, goals, ecommerce
- Funnels (from 193 EUR a year), Cohorts and Users Flow (from 94 EUR each) as plugins
- Heatmap & Session Recording and A/B Testing (from 219 EUR a year each)
- Tag manager, GDPR tools and Google Analytics import built in
Pricing
On-Premise is free under GPL-3.0 with unlimited hits; you run PHP and MySQL yourself. Cloud starts at 29 a month for 50,000 hits (shown without a currency symbol; Matomo bills in EUR or USD by region) with a 21-day trial, and volumes above 10M hits are custom. Plugin prices are the "from" prices on Matomo's pricing page and rise with the number of users. Source: matomo.org/pricing.
Pros
- 18 years of development, a large plugin marketplace and Google Analytics import
- Full data ownership on your own servers
- Cookieless mode and consent tools that satisfy strict regulators
Cons
- Funnels, cohorts and replay cost extra even self-hosted; a basic product analytics set is about 500 EUR a year in plugins
- PHP and MySQL need tuning at scale
- No user-level profiles comparable to Mixpanel's
Compare: Matomo vs OpenPanel
Which product analytics tool should you pick?
- Choose Mixpanel if you want the deepest self-serve reports and your volume stays under 1M events a month, or you can budget $840 a month at 10M.
- Choose Amplitude if you run experiments at scale, need governance across many teams, and want 2M free events to start.
- Choose PostHog if your engineers want feature flags, replay and SQL alongside analytics and accept metered pricing and a heavy script.
- Choose OpenPanel if you want web and product analytics in one place, replay included, cookie-free tracking with EU hosting or self-hosting, and a flat bill.
- Choose Heap or Fullstory if you cannot instrument events up front; Fullstory when replay quality matters most.
- Choose Pendo if in-app guides and surveys matter as much as the analytics.
- Choose Countly for a mobile app that needs crash reporting and push on your own servers.
- Choose GA4 if marketing attribution is the job and sampling is acceptable.
- Choose Matomo if you are leaving Google Analytics, need data ownership, and your product analytics needs are modest.
For the options you can run yourself, see self-hosted product analytics.