

Funnels: where do users drop off?
Build funnels from your events and see conversion and drop-off at every step. No complex setup, just pick the events and go.
- Find drop-off points
- No sampling
- Segment by any property
- Real-time conversion rates
What is funnel analysis?
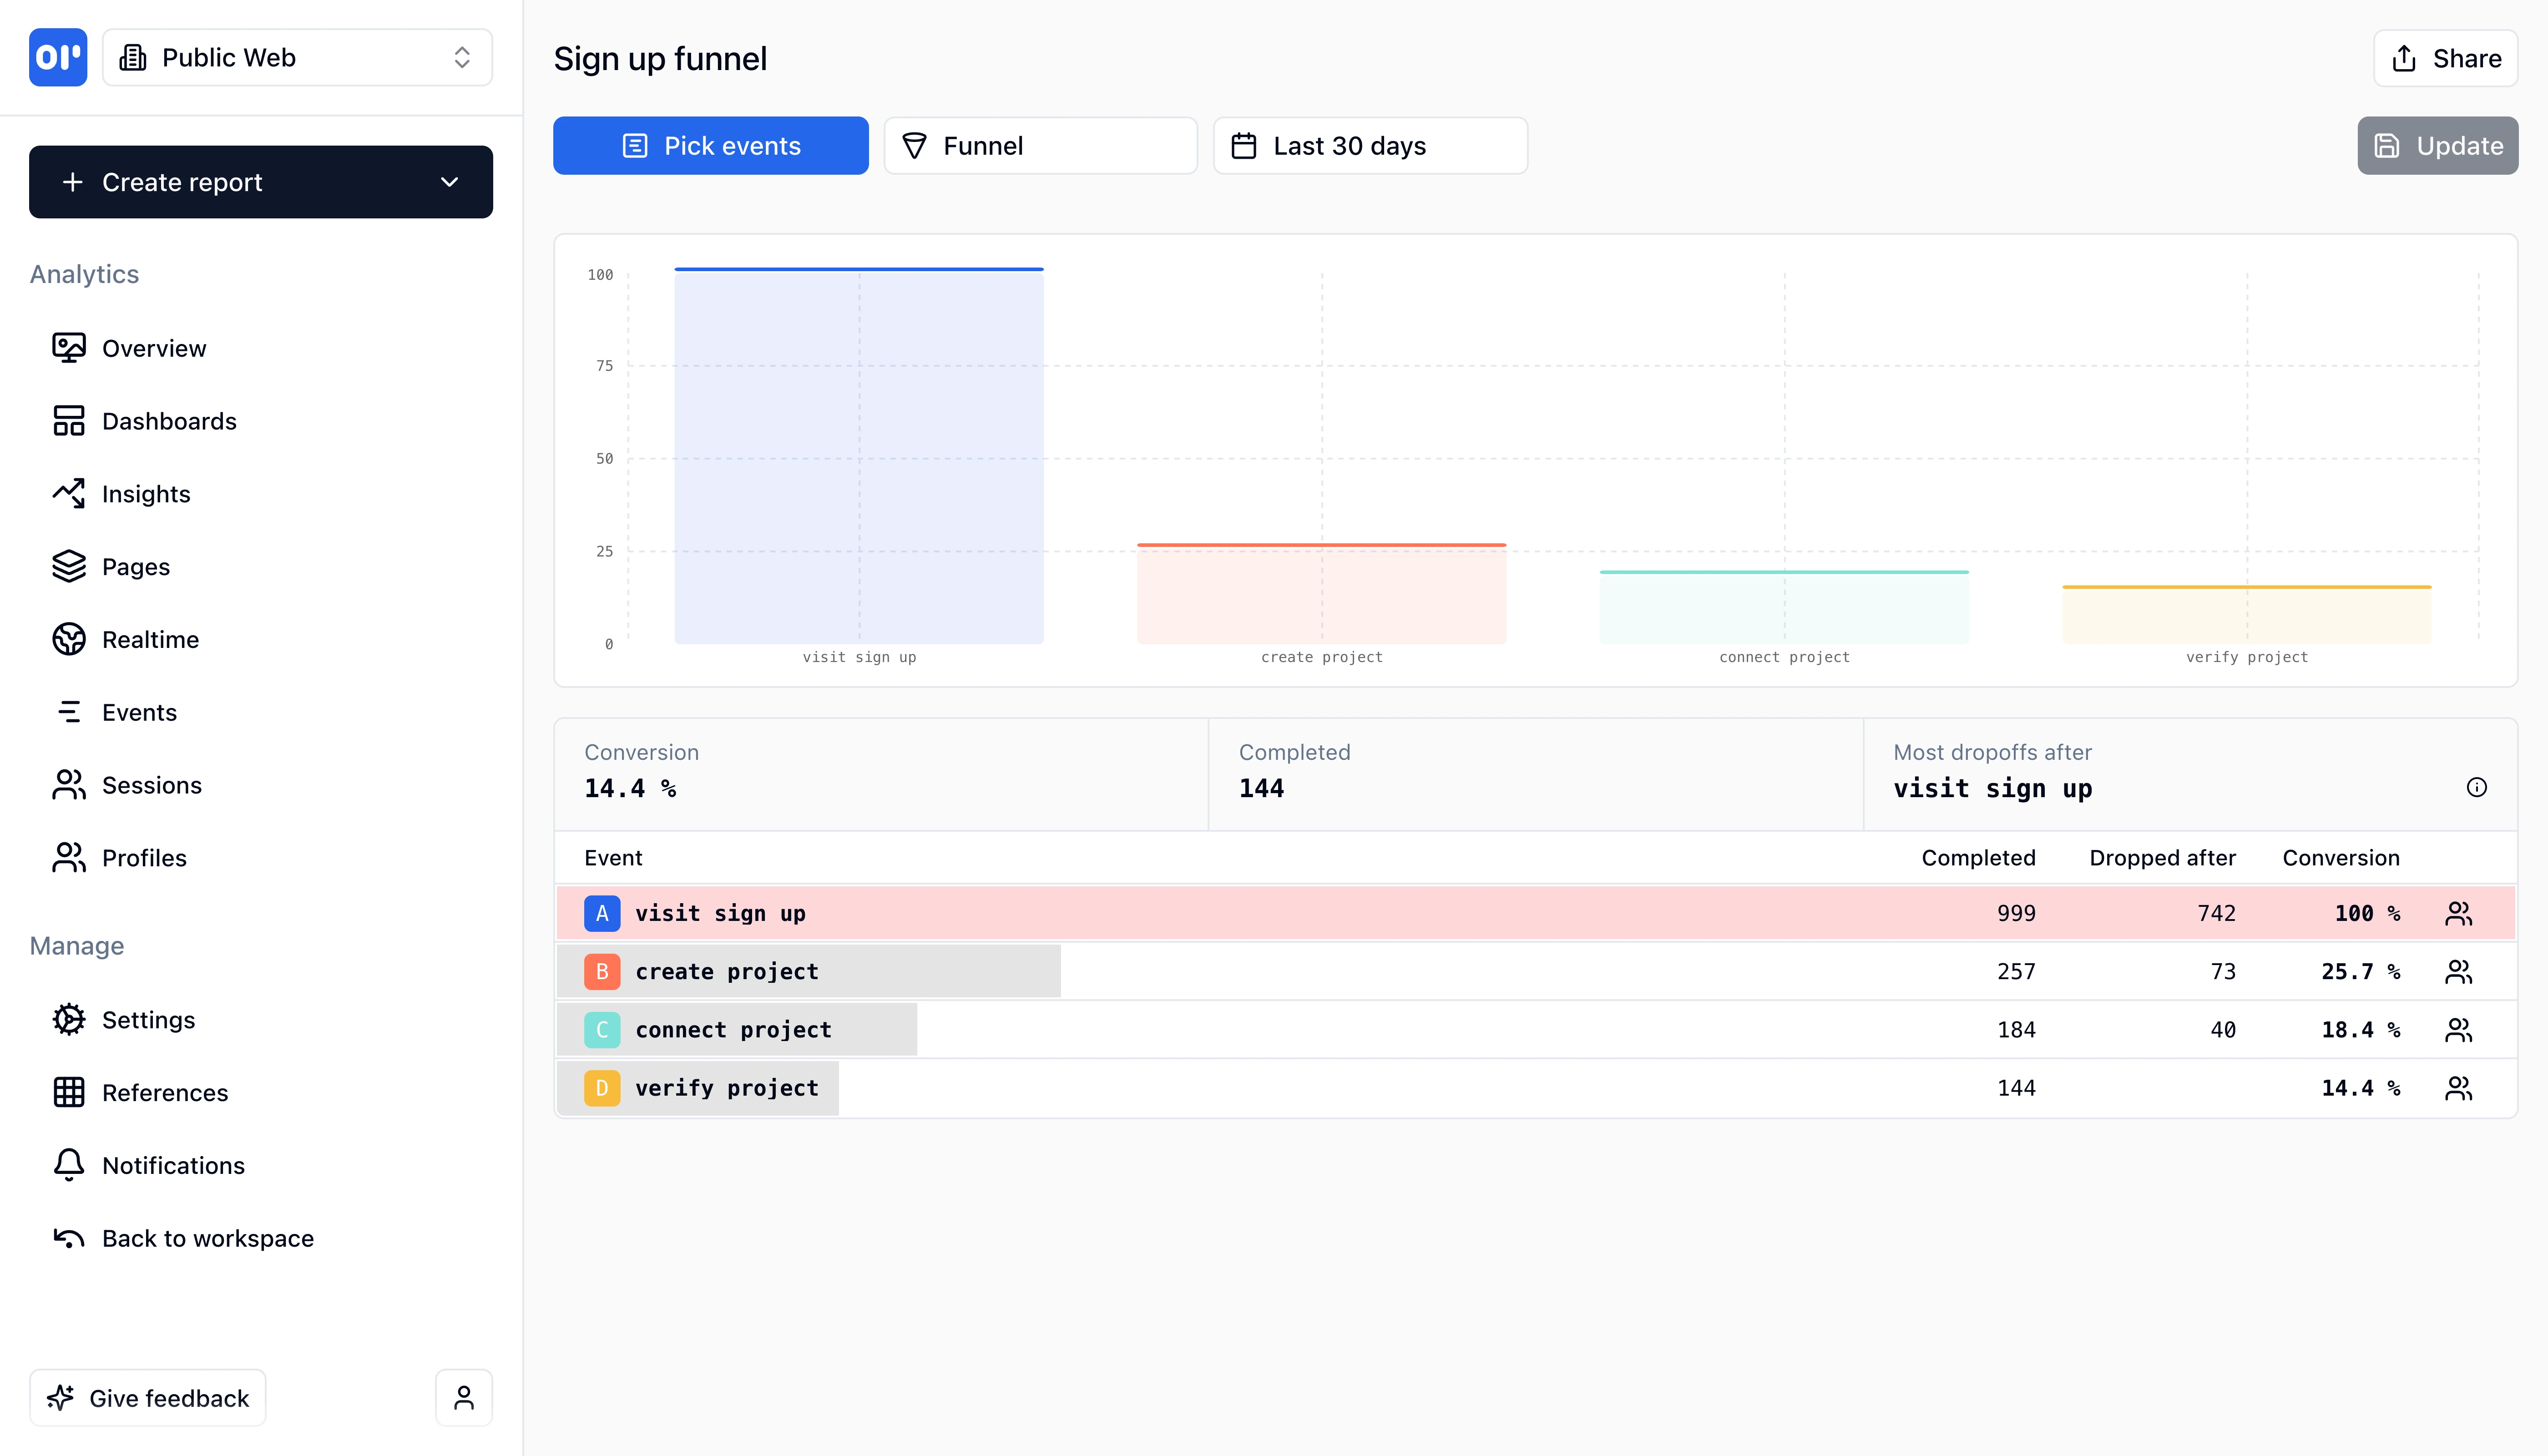
A funnel is a sequence of steps you expect users to complete-for example: visited homepage → signed up → verified email → created first project. Funnel analysis shows you how many users complete each step and where they leave.
Most products lose the majority of their users somewhere in the journey. Without funnel analysis, you're guessing where. With it, you can see:
- Step-by-step conversion rates - what percentage of users move from one step to the next
- Biggest drop-off points - where the most users abandon the flow
- Time between steps - how long users take, and where they get stuck
- Segment differences - whether users from organic search convert differently than paid traffic
Unlike traditional analytics tools that require complex configuration, OpenPanel funnels are built directly on your events. If you're already tracking signup_started, signup_completed, and first_action, you can create a funnel from those events in seconds-no extra instrumentation needed.
Funnels in OpenPanel use every event (no sampling) and update in real time. You can add filters, compare segments, and save funnels to dashboards alongside retention charts and other reports.
What you can do with funnels
From signup to revenue, funnels help you find and fix friction.
Signup and onboarding funnels
Track visit → signup → email verified → first action. See where prospects drop and optimize the path.
Activation funnels
Define activation as a sequence of events (e.g. created project → invited teammate → first export). Measure time to activate.
Conversion and revenue funnels
From trial started to paid conversion, or from add to cart to purchase. Tie steps to revenue events.
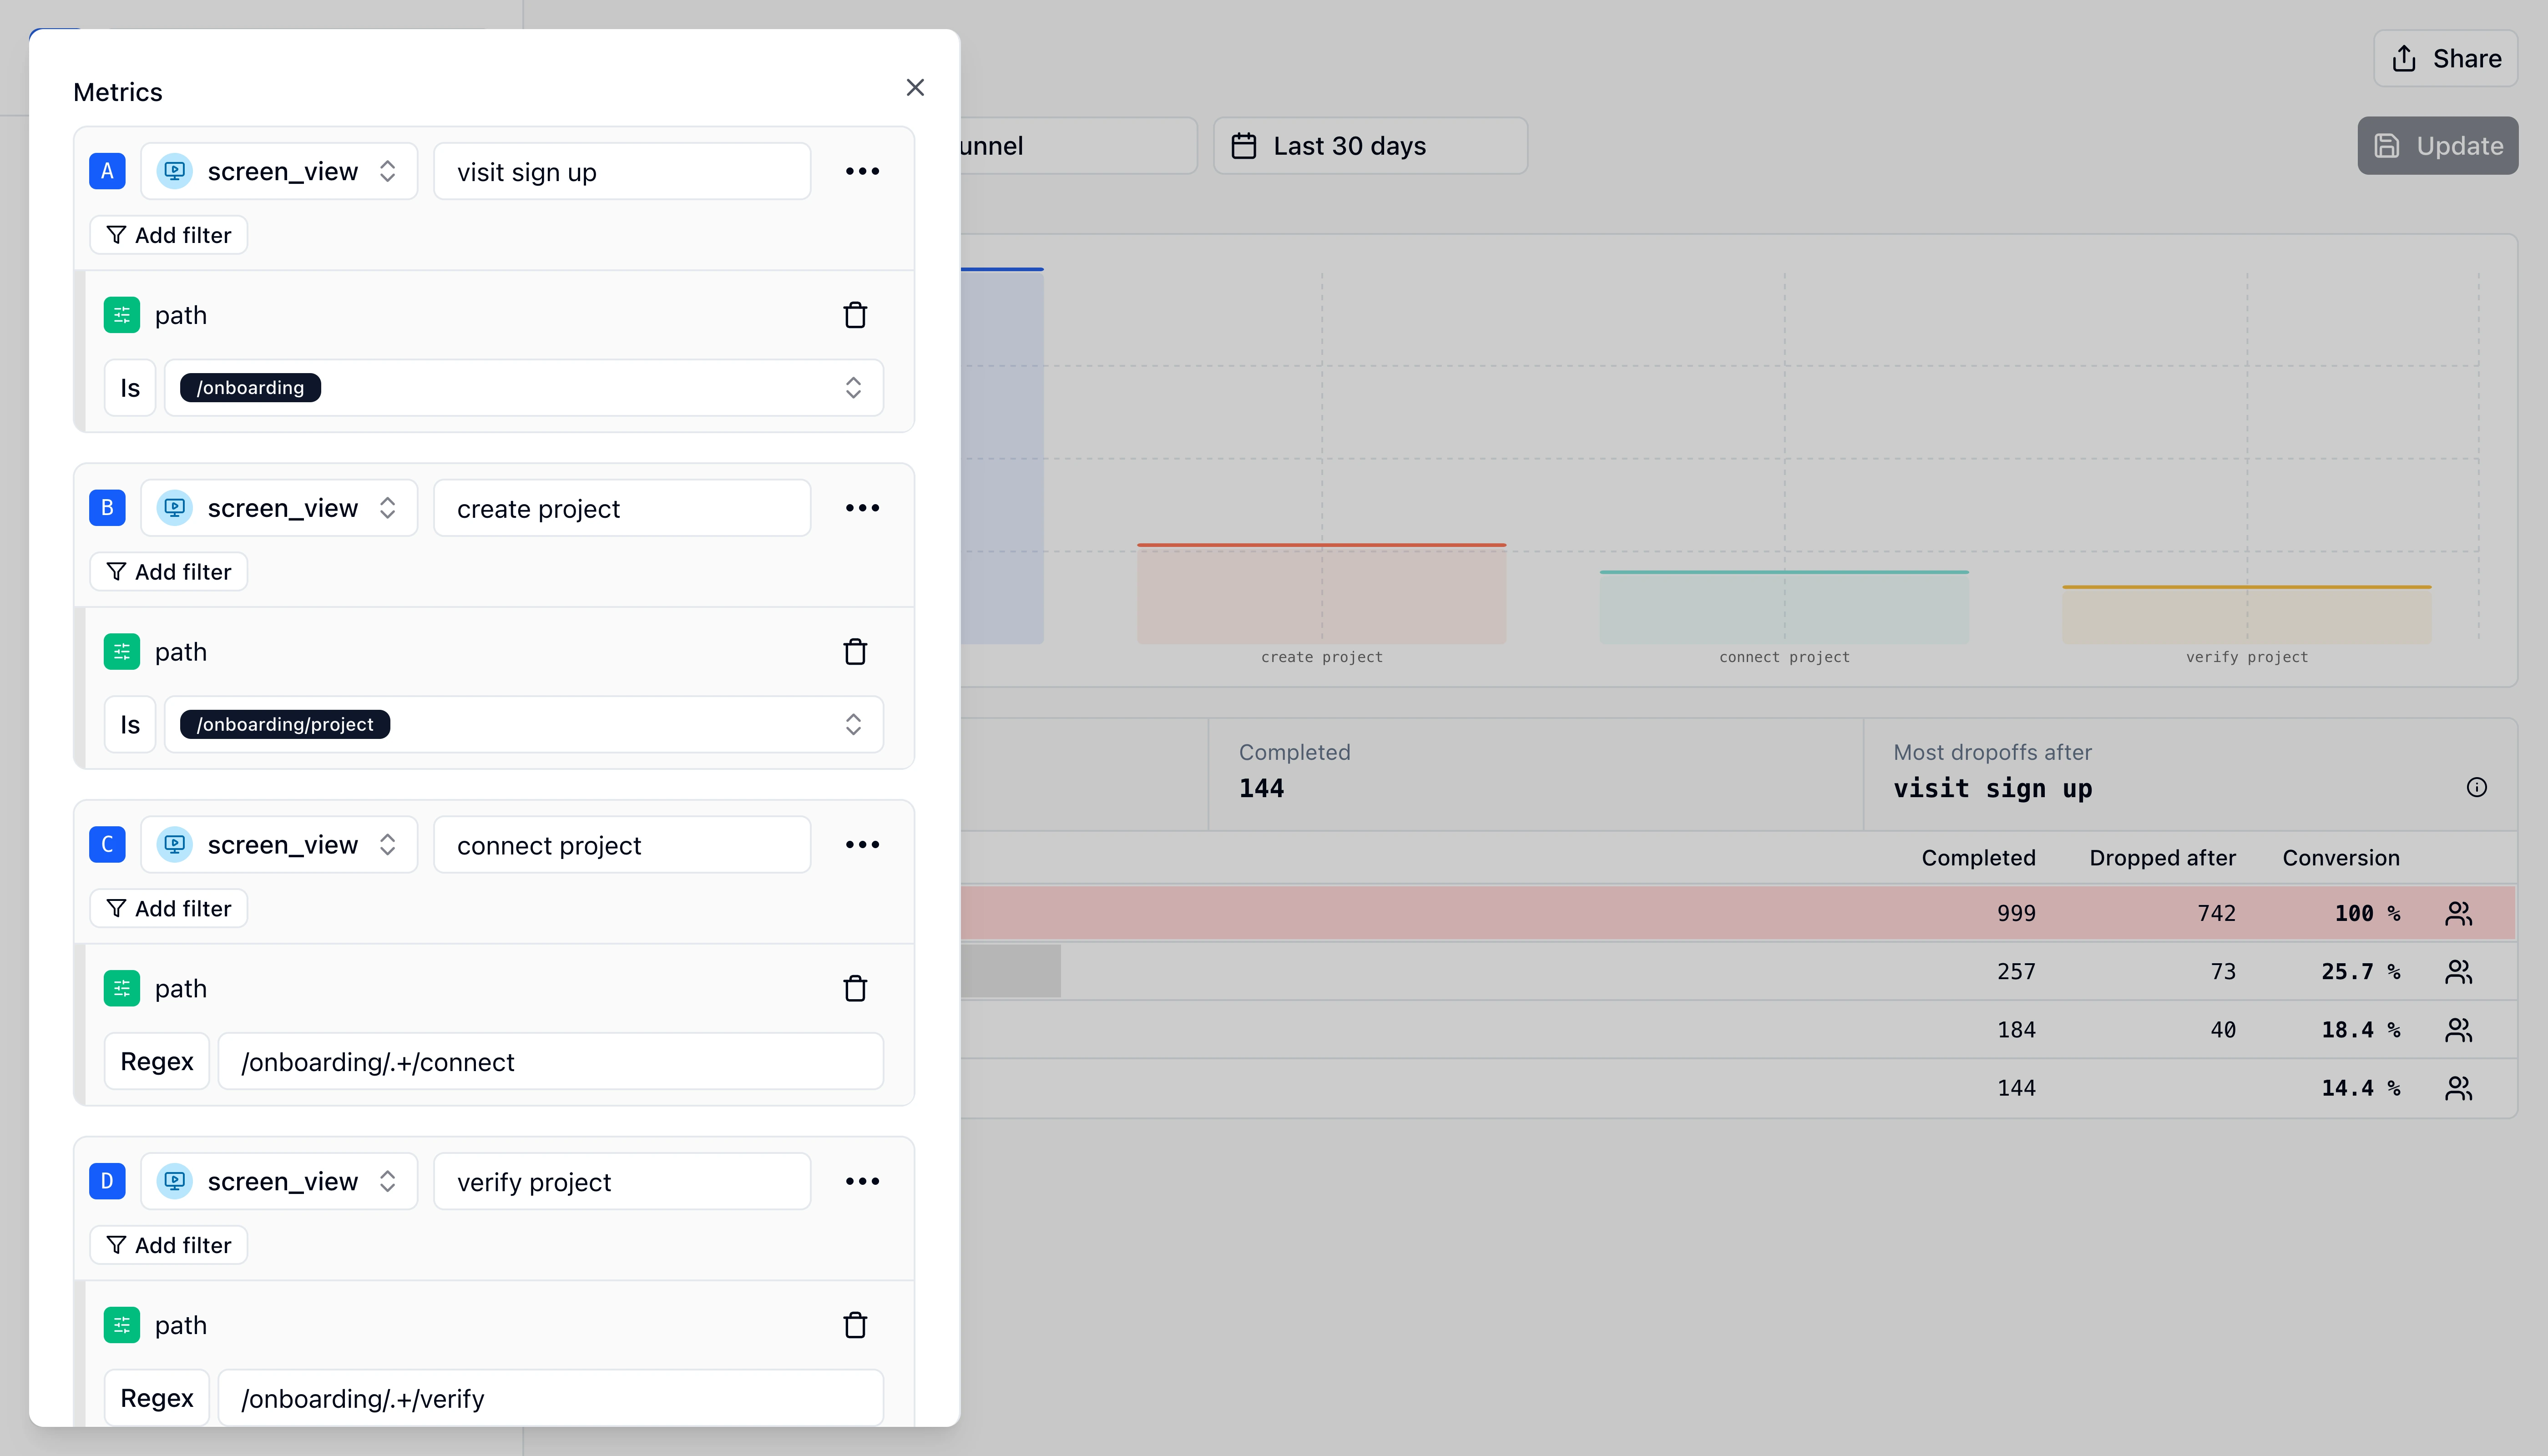
Flexible step definition
Each step can be a single event or a group of events. Filter by properties (e.g. plan, source) to compare segments.
Conversion and drop-off rates
See percentage completing each step and overall conversion. No sampling-every event counts.
Time between steps
Understand how long users take between steps. Identify slow or stuck segments.
How funnel analysis works
Funnels in OpenPanel are defined by the events you already track.
Track the right events
Ensure the events that represent each step (e.g. signup_completed, project_created) are sent from your product. No funnel-specific tracking needed.
Create a funnel report
In OpenPanel, create a funnel and add steps: each step is one or more events. Optionally add filters (e.g. by plan or campaign).
Read conversion and drop-off
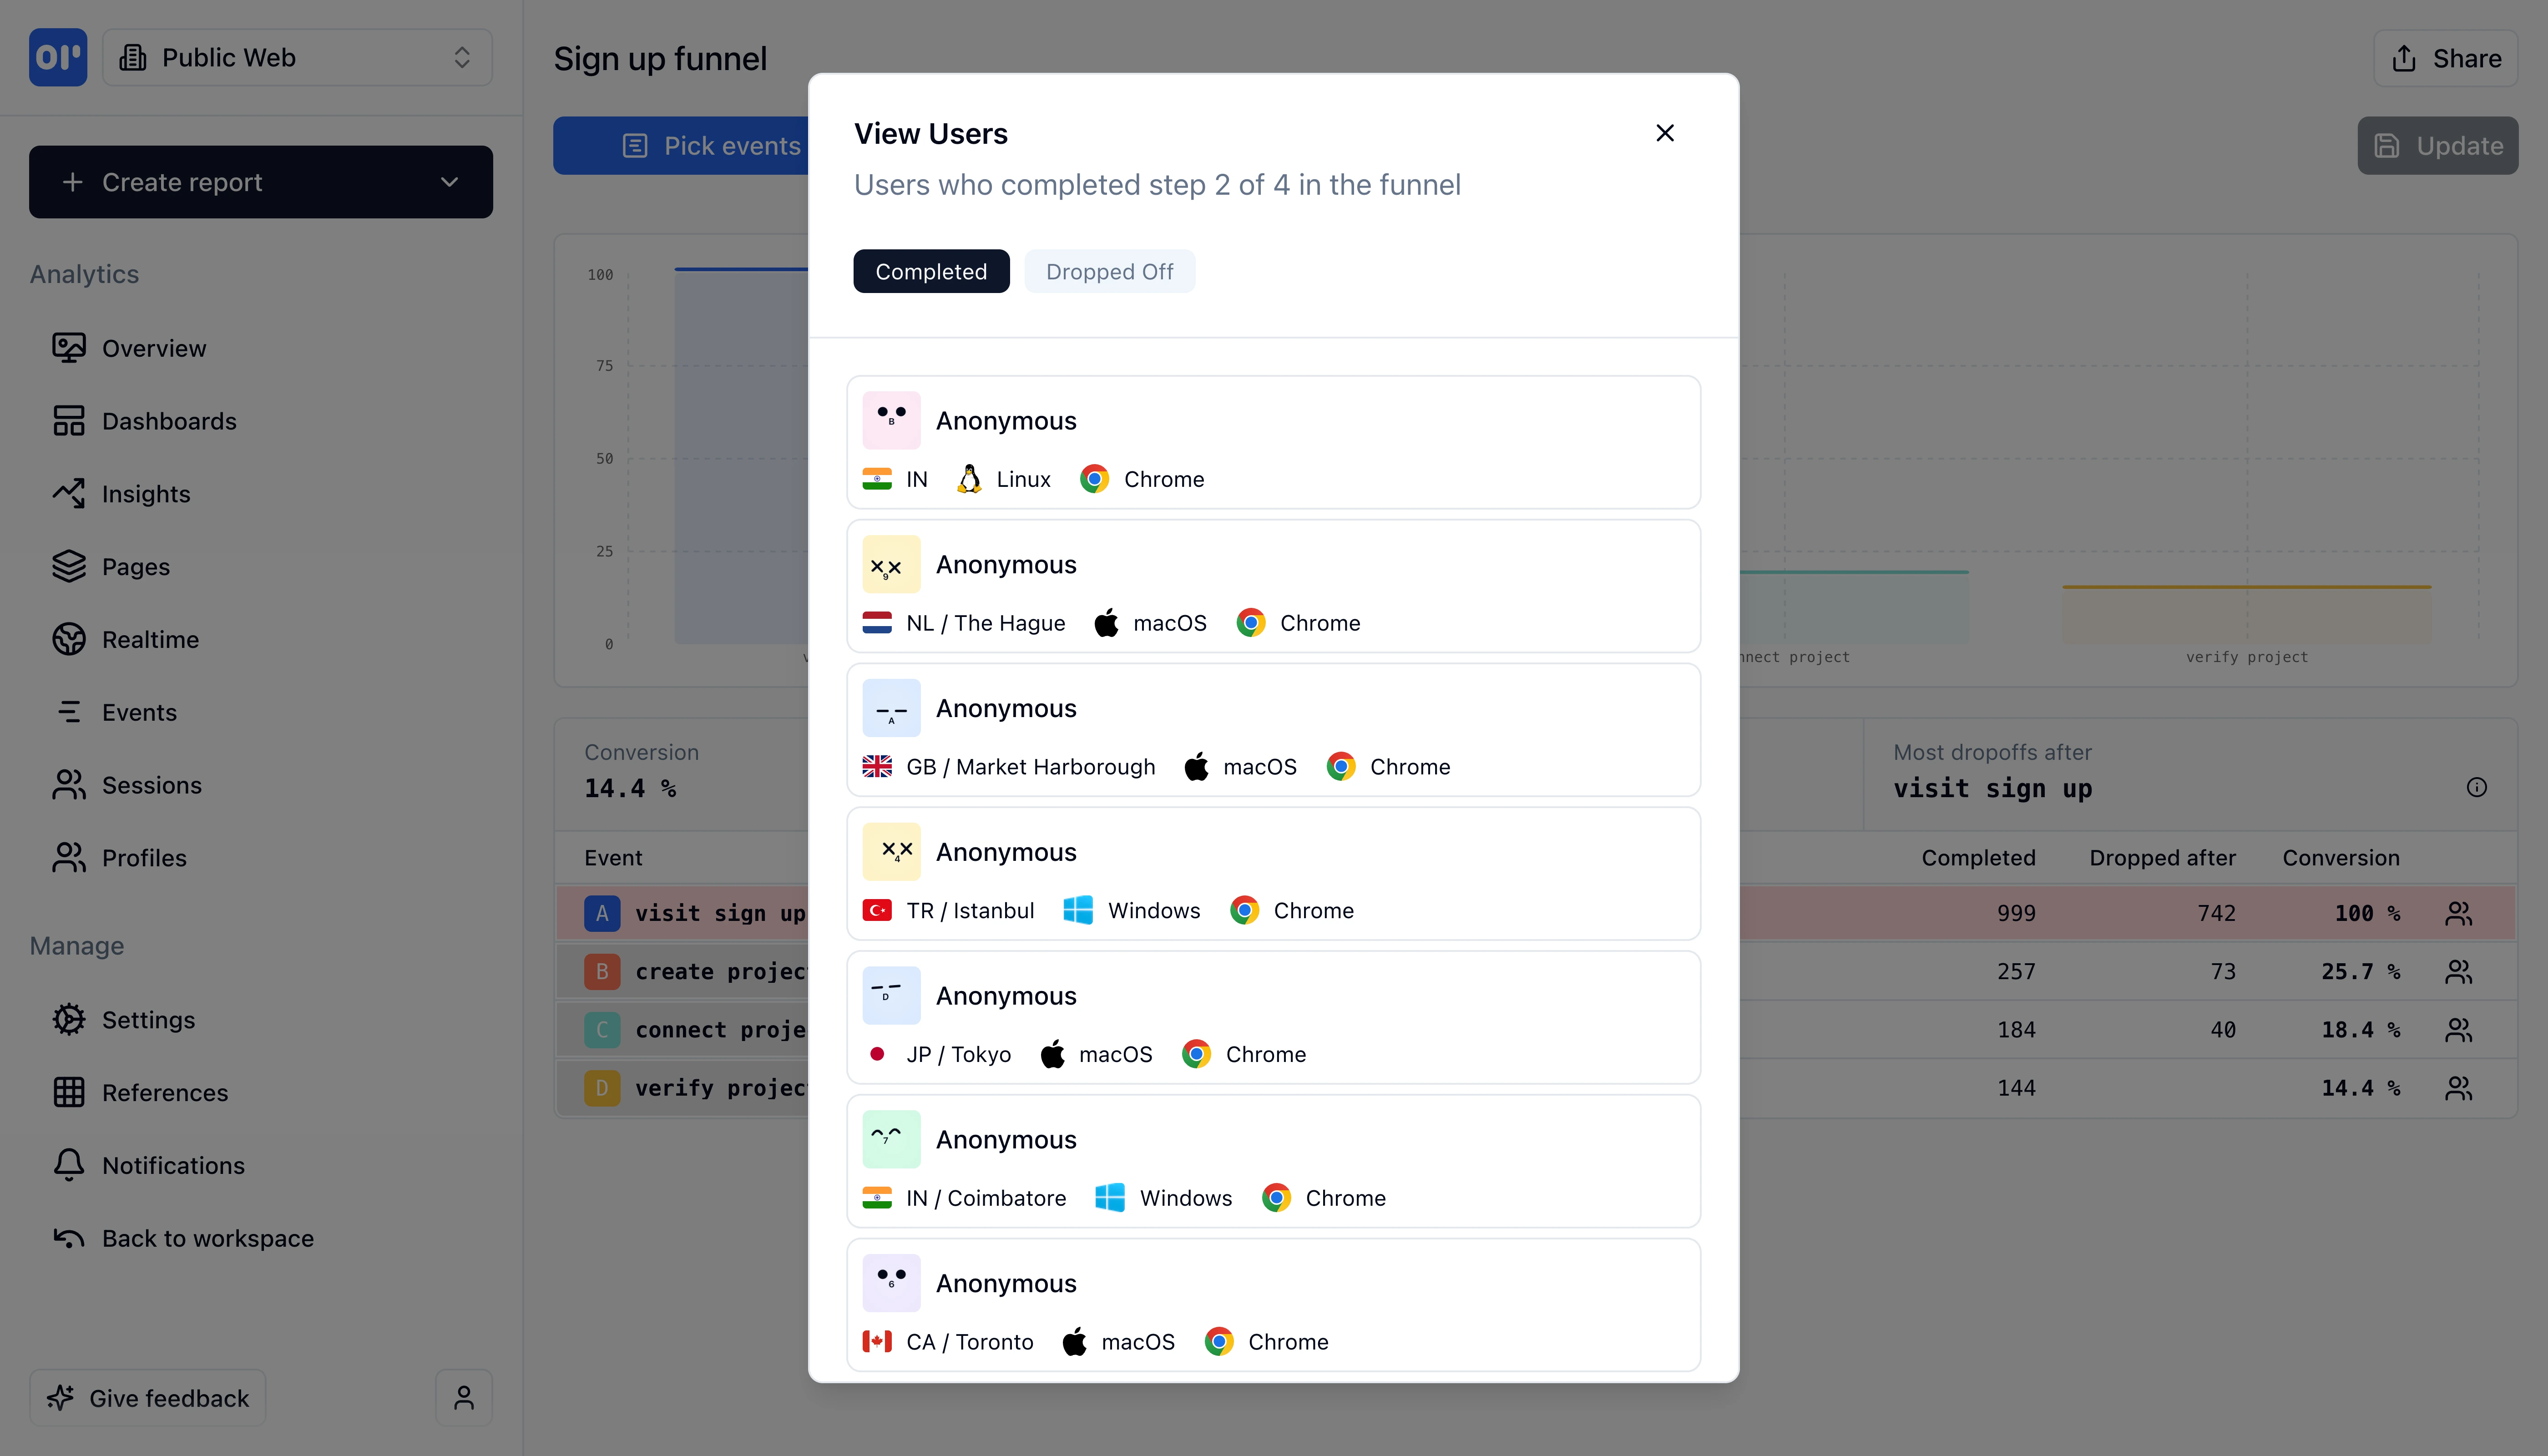
See how many users completed each step, the conversion rate between steps, and where the biggest drop-off happens. Use this to prioritize fixes.
Who uses funnel analysis
Teams use funnels to make decisions about product and growth.
Product and growth teams
Find the biggest drop-off in signup or activation and run experiments to improve conversion. Measure impact with the same funnel.
Marketing
Compare funnel conversion by traffic source or campaign. Double down on channels that convert and fix landing pages that don't.
Founders and operators
Get a single view of the journey from visitor to paying customer. No spreadsheets-just events and funnel reports.
Related features
Explore more capabilities that work together with this feature.
Frequently asked questions
Common questions about funnel analysis with OpenPanel.
Ready to get started?
Track events in minutes. Free 30-day trial, no credit card required.
Build your first funnel