

Retention: Who comes back?
See who returns after signup, activation, or any key action. Cohort-based retention that shows real stickiness - not vanity metrics.
- Cohort-based retention
- Any start and return event
- No sampling
- Compare segments
What retention means
Retention is the share of users who come back after doing something once. It answers: Of the people who did X in a given week, how many did Y later?
That's it. No session thresholds, no arbitrary "active" definitions, just a clear picture of who sticks and who doesn't.
Traffic and signups can look great while the product fails to stick. Retention tells you what those numbers can't:
- Whether your product is habit-forming - Do users return after the first use?
- When churn happens - Do they leave after day 1, week 1, or month 1?
- Which segments stick - Do certain cohorts (e.g. by plan, source, or feature) retain better?
In OpenPanel, retention is built on your events. You choose an initial event (e.g. signup_completed, first_purchase) and a return event (e.g. feature_used, session_started). OpenPanel groups users into cohorts by when they did the initial event and shows what percentage did the return event in subsequent periods. No extra instrumentation-the same events that power funnels and user profiles power retention.
What you can do with retention
From weekly cohorts to segment comparison, retention gives you the stickiness signal.
Cohort-based retention
Group users by when they did an initial event (e.g. signup week). See what percentage return in week 1, 2, 3, and beyond.
Any start and return event
Define retention your way: signup → login, first purchase → repeat purchase, feature_used → feature_used again. No fixed definitions.
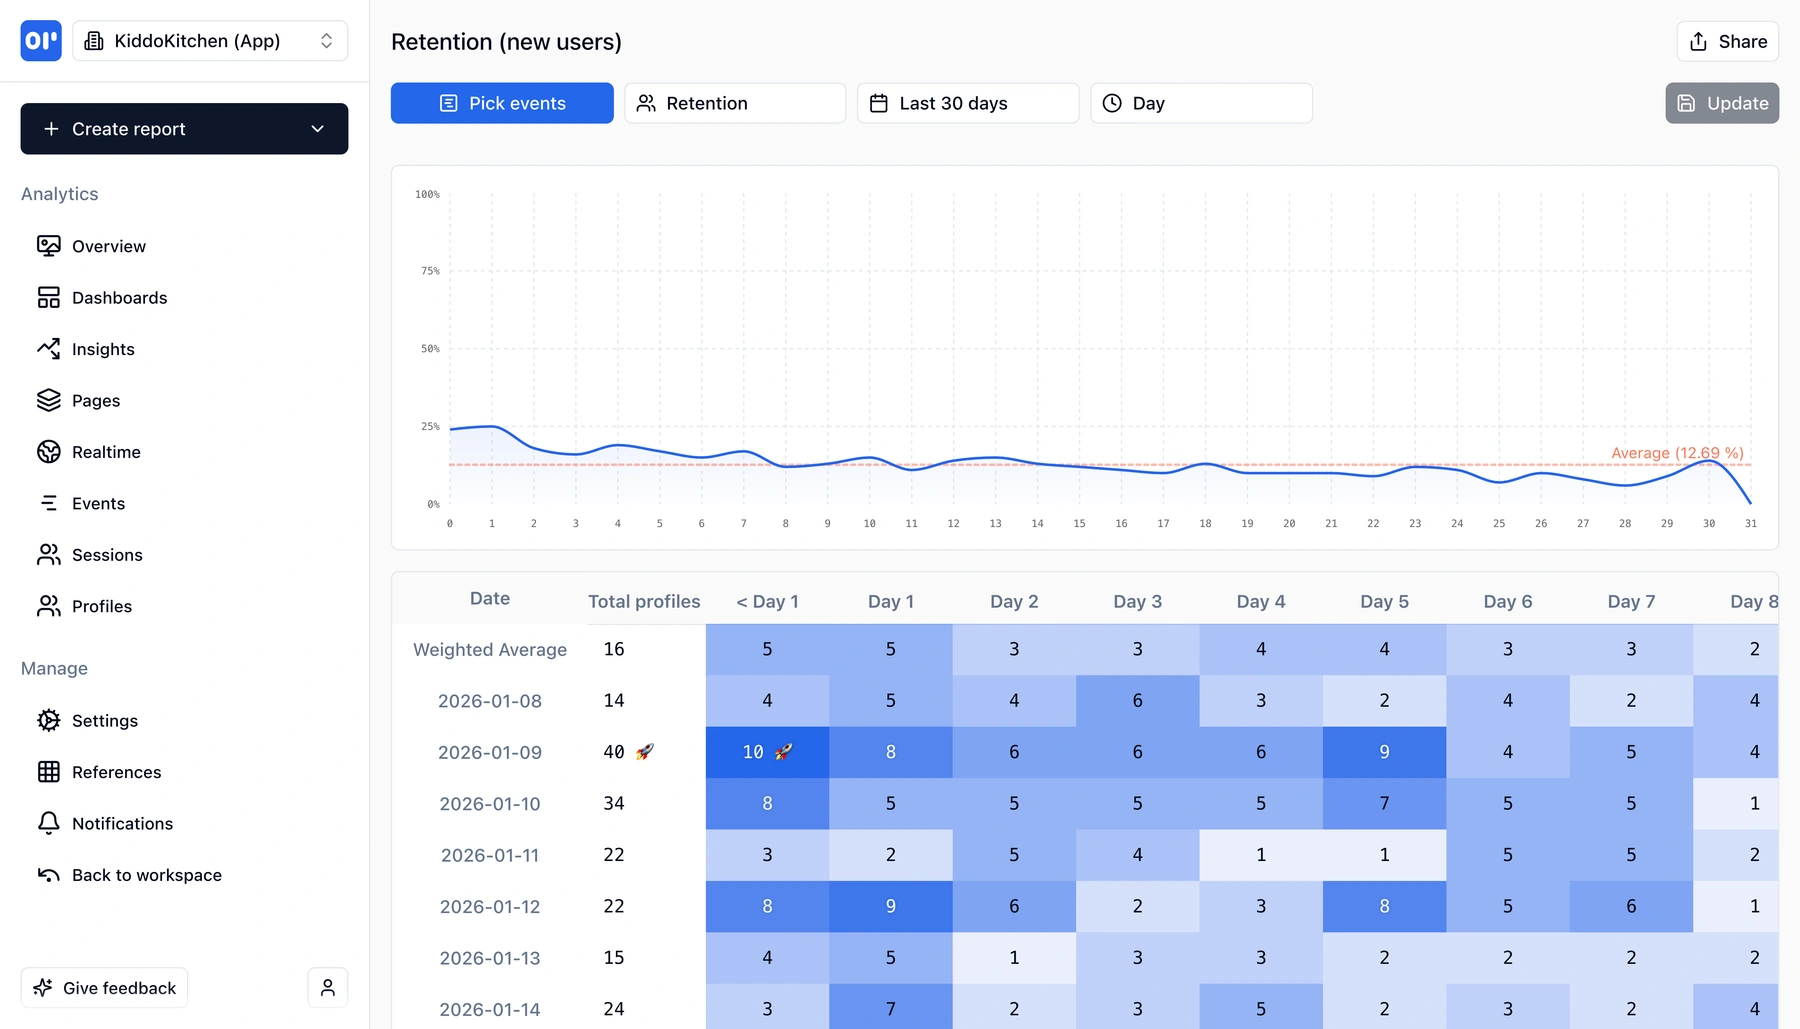
Read the grid at a glance
Retention grids show cohorts in rows and time periods in columns. High numbers = stickiness; drop-off patterns show where to focus.
Compare segments
Filter or segment by plan, source, or custom properties. See which cohorts retain better and why.
No sampling
Retention is computed over every event. No sampling or estimates-you see real stickiness.
Dashboards and sharing
Add retention charts to dashboards next to funnels and other reports. Share with PMs and founders.
How to read a retention chart
Retention charts are simple once you know what to look for.
Pick your initial and return events
The initial event defines the cohort (e.g. signup_completed). The return event defines "came back" (e.g. session_started or feature_used). Every user who did the initial event in a given period is one cohort.
Read the grid
Rows are cohorts (e.g. "Week of Jan 6"). Columns are time periods after the initial event (e.g. Week 1, Week 2). Each cell is the percentage of that cohort that did the return event in that period. Higher = stickier.
Spot patterns
Look for cohorts that retain well vs. those that drop off fast. Compare segments (e.g. by plan or source) to see which users stick and use that to prioritize product and growth work.
How teams use retention
PMs and founders use retention to separate signal from noise.
Product managers
See which features and flows lead to repeat use. Prioritize work that improves retention, not just signups. Compare cohorts to learn what separates sticky users from churned ones.
Founders
Retention is the truth about product-market fit. One number-e.g. week-2 or week-4 retention-often tells you more than top-line growth. Use it in board updates and strategy.
Growth and analytics
Measure impact of onboarding or activation changes on retention. Segment by acquisition source or plan to invest in the channels and segments that retain best.
Related features
Explore more capabilities that work together with this feature.
Frequently asked questions
Common questions about retention analytics with OpenPanel.
Ready to get started?
Track events in minutes. Free 30-day trial, no credit card required.
See your retention in minutes