

Product analytics tells you what users do inside your product — which features they use, where they drop off, how often they come back, and what paths they take before converting. It's the difference between knowing "we got 10,000 pageviews" and knowing "40% of users who start onboarding never finish step 3."
If you want those insights without sending user behavior data to a third party, self-hosted product analytics is the way to go.
But here's the problem: most self-hosted analytics tools only cover web analytics — pageviews, traffic sources, and referrals. Product analytics features like funnels, retention, cohorts, and user identification require a different class of tool.
We compared every self-hosted tool that offers real product analytics capabilities. Here's what's worth your time.
Quick comparison
| Tool | Focus | License | Self-Host Cost | Cloud Pricing (from) | Best For |
|---|---|---|---|---|---|
| OpenPanel | Web + Product | AGPL-3.0 | Free | $2.50/mo | Teams wanting Mixpanel-like analytics, self-hosted |
| PostHog | Product + Web | MIT | Free | $0 + usage | Dev teams needing analytics + flags + experiments |
| Countly | Product + Mobile | AGPL-3.0 | Free (Community) | Custom | Mobile-first product analytics |
| Matomo | Web (+ Product plugins) | GPL-3.0 | Free (core) | €29/mo | GA replacement with product add-ons |
| Mitzu | Product | Source Available | Paid | Custom | Warehouse-native product analytics |
What makes product analytics different from web analytics
Web analytics answers questions about your website traffic: where visitors come from, which pages they view, and how long they stay. Tools like Plausible, Umami, and GoatCounter do this well.
Product analytics goes deeper. It answers questions about user behavior:
- Funnels: What percentage of users complete signup? Where exactly do they drop off?
- Retention: Are users coming back after their first week? First month?
- User journeys: What do users do before upgrading to a paid plan?
- Cohort analysis: Do users who onboard on mobile retain better than desktop users?
- Event tracking: Which features get used? How often? By whom?
If you're building a SaaS, mobile app, or any product where understanding user behavior matters, you need product analytics — not just pageview counts.
For a comparison of self-hosted tools focused purely on web analytics, see our self-hosted web analytics guide.
OpenPanel
Best for: Teams that want Mixpanel-like product analytics with a self-hosted option
OpenPanel gives you what tools like Mixpanel and Amplitude do without sending your data to a third party. It combines web analytics and product analytics in one platform, with cookieless tracking and a simple self-hosting setup.
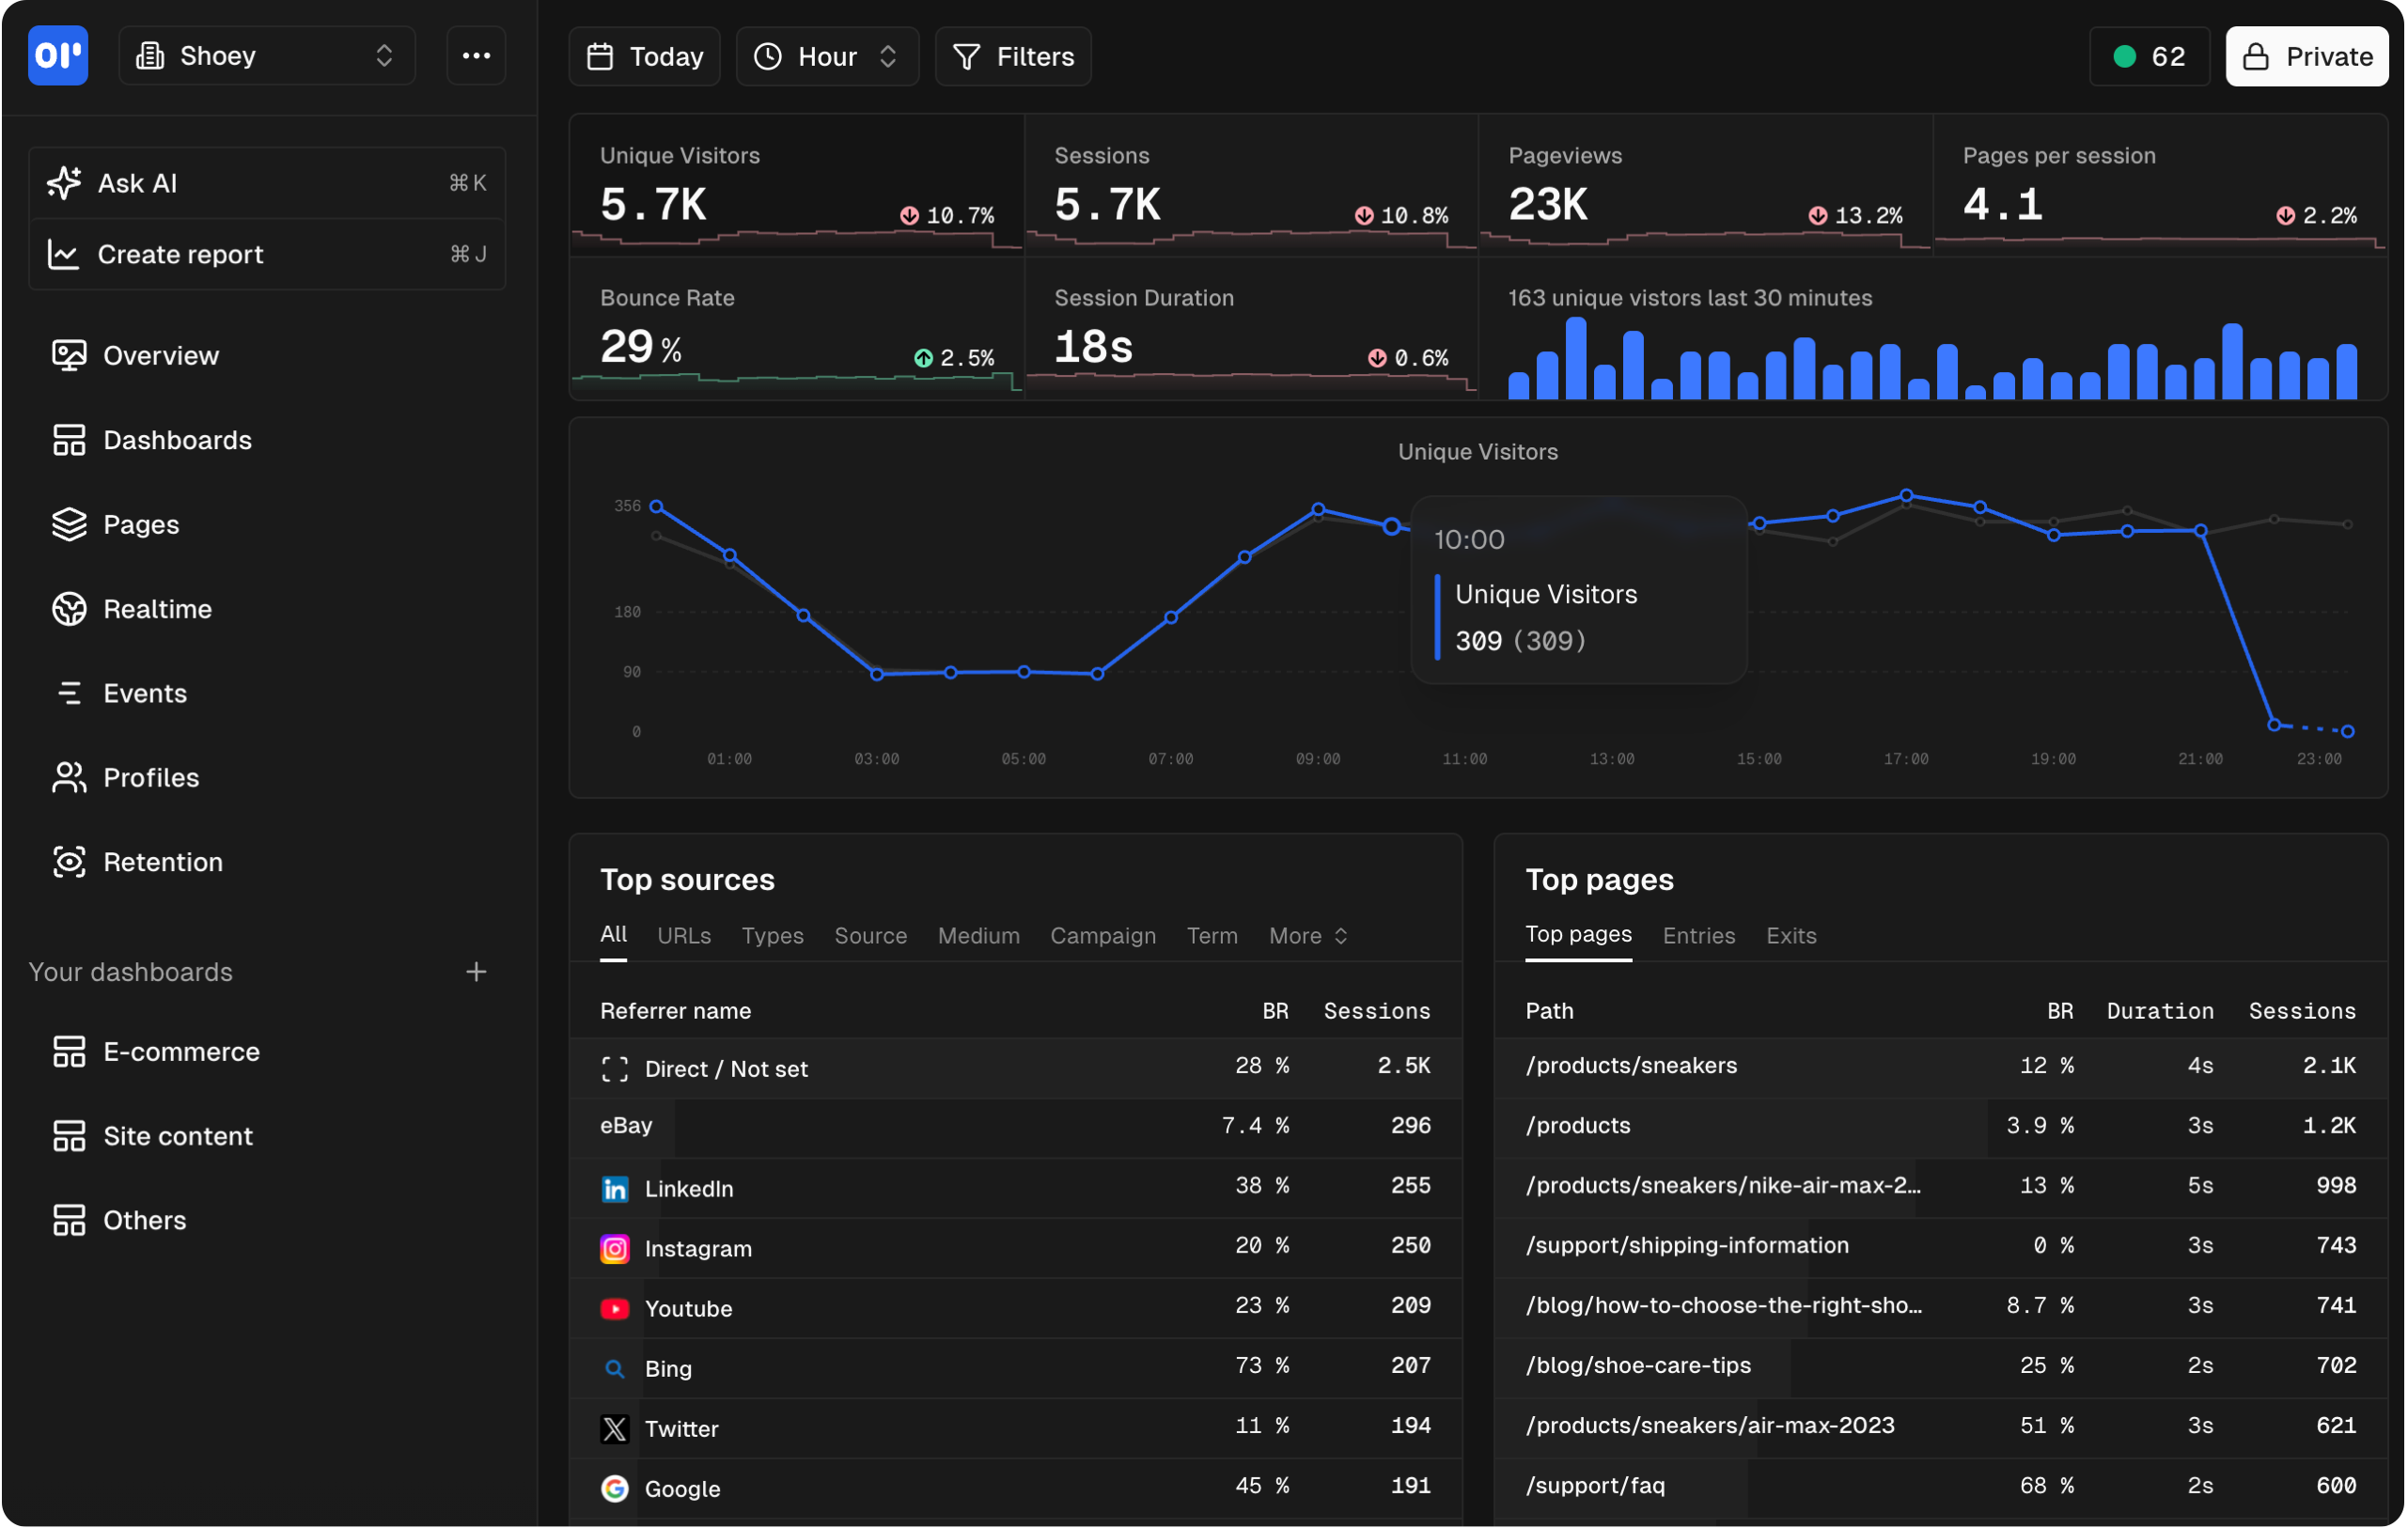
Product analytics features
- Funnels: Build multi-step conversion funnels with any events. See where users drop off and break down by properties.
- Retention: Analyze how many users come back over time. Compare retention across cohorts, plans, or acquisition channels.
- Event tracking: Track any custom event with properties. Visualize with charts, tables, and breakdowns.
- User identification: Link events to individual users. View complete user profiles with their full event history.
- Session tracking: See individual sessions with the full sequence of events and pages.
- Real-time dashboards: Custom dashboards with multiple chart types, updated in real time.
Deployment
Four commands to self-host:
git clone -b self-hosting https://github.com/Openpanel-dev/openpanel && cd openpanel/self-hosting && ./setup
./start
Runs on Docker Compose with ClickHouse, PostgreSQL, and Redis. A mid-range VPS (4 vCPU, 8 GB RAM) handles millions of events. The setup wizard handles configuration, database setup, and SSL.
Full guide: How to self-host OpenPanel | Self-hosting docs
Pricing
Self-hosting is free. All features included — the self-hosted version is identical to the cloud version with no feature gating.
Cloud plans start at $2.50/month (5,000 events) and scale to $90/month for 1 million events. Every tier includes every feature.
Pros
- Full product analytics (funnels, retention, user profiles) plus web analytics in one tool
- Simplest self-hosting setup among tools with comparable features
- Cookieless tracking — no consent banners needed
- Self-hosted and cloud versions are identical
- Multiple SDKs: JavaScript, React, Next.js, Vue, React Native, Flutter, and more
Cons
- Newer project — smaller community than PostHog or Matomo
- No built-in heatmaps yet
- No built-in feature flags or A/B testing
PostHog
Best for: Engineering teams that want analytics, feature flags, and experiments in one platform
PostHog is the most feature-rich self-hosted product analytics tool. It bundles product analytics with session replay, feature flags, A/B testing, surveys, and error tracking. If you want one tool that does everything for product development, PostHog is the most complete option.
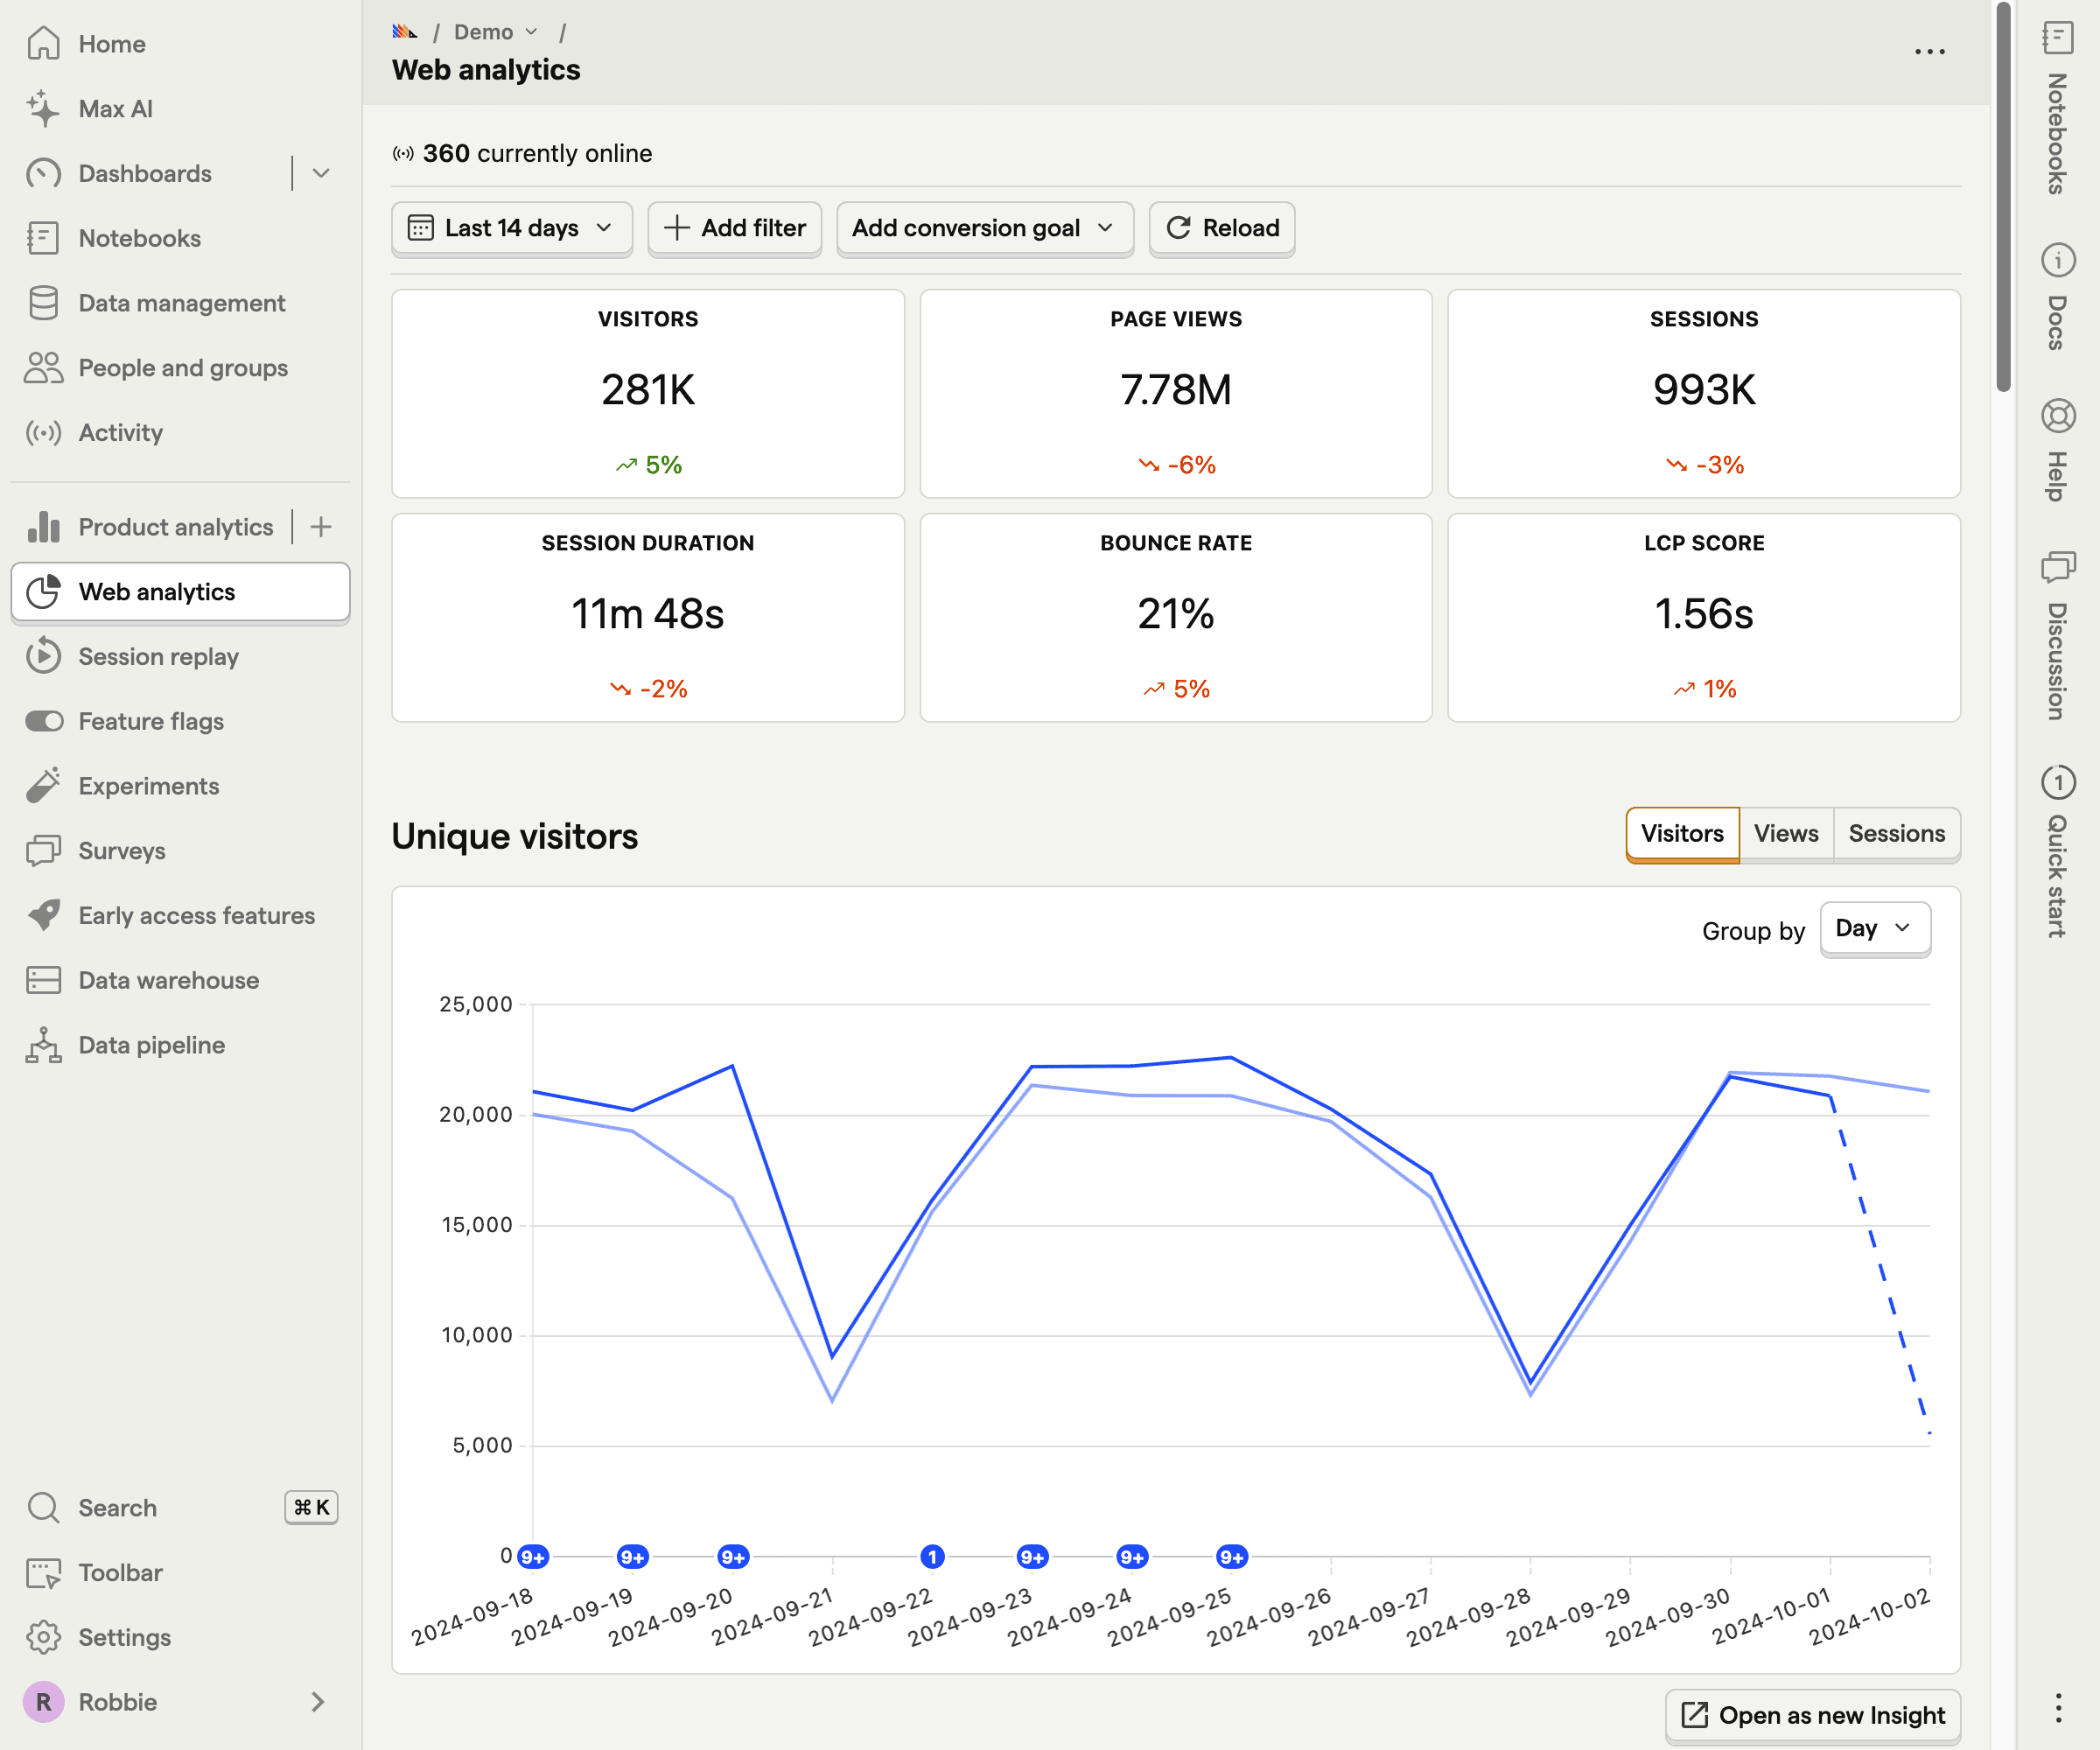
Product analytics features
- Funnels: Multi-step funnel analysis with breakdown by user properties
- Retention: Cohort-based retention analysis
- User paths: Visualize how users navigate through your product
- Cohorts: Group users by behavior, properties, or lifecycle stage
- Session replay: Watch recordings of actual user sessions
- Feature flags: Roll out features to specific user segments
- A/B testing: Run experiments and measure impact on metrics
- Surveys: Collect in-product feedback
Deployment
PostHog self-hosting uses Docker Compose for small deployments or Kubernetes (Helm charts) for production. The infrastructure stack includes PostgreSQL, Redis, ClickHouse, and Kafka — significantly more complex than other options.
Requirements: Minimum 4 vCPU, 16 GB RAM, 30 GB+ storage. PostHog recommends self-hosting only for up to ~300K events/month. Beyond that, they push you toward their cloud offering.
Pricing
Self-hosting is free under MIT license. The cloud free tier covers 1 million analytics events, 5,000 session recordings, and 1 million feature flag requests per month. Past that, usage-based pricing kicks in (roughly $0.00005 per event for the next million).
Pros
- Most comprehensive feature set of any self-hosted analytics tool
- MIT license — very permissive
- Cloud free tier (1M events) to get started
- Active community and rapid development cycle
Cons
- Complex self-hosting with multiple infrastructure dependencies
- Resource-heavy — needs 4x the RAM of simpler tools
- Self-hosted and cloud versions aren't feature-equivalent
- Can be overwhelming — lots of features most teams won't use
- PostHog actively discourages self-hosting at scale
Compare with OpenPanel: PostHog vs OpenPanel
Countly
Best for: Mobile-first product analytics with self-hosting
Countly is a product analytics platform with strong mobile analytics roots. It supports web, mobile, and desktop apps with SDKs for iOS, Android, React Native, Flutter, and more. The Community Edition is self-hostable under AGPL-3.0.
Product analytics features
- Funnels: Define conversion funnels and track drop-off rates
- Retention: Cohort retention analysis with configurable time periods
- User profiles: Individual user tracking with event history
- Segmentation: Filter and segment users by properties and behaviors
- Push notifications: Built-in push notification system (mobile)
- Crash reporting: Crash analytics for mobile apps
Deployment
Countly self-hosts with Docker or manual installation on Linux. It uses MongoDB as its primary database. The setup is straightforward but requires MongoDB expertise for production deployments.
Requirements: 4 vCPU, 8 GB RAM minimum. MongoDB 6+. More resources needed for high-traffic mobile apps.
Pricing
The Community Edition is free under AGPL-3.0 but has limited features. Enterprise pricing is custom and includes advanced analytics, push notifications, crash reporting, and dedicated support. Expect significant cost for the Enterprise version.
Pros
- Strong mobile analytics with native SDKs for all major platforms
- Built-in push notifications and crash reporting
- Established platform with enterprise customers
- Good for mobile-first or hybrid app analytics
Cons
- Community Edition is feature-limited — most product analytics features require Enterprise
- Enterprise pricing is opaque and expensive
- MongoDB-only — no PostgreSQL or ClickHouse option
- UI feels dated compared to newer tools
- Smaller open source community than PostHog
Compare with OpenPanel: Countly vs OpenPanel
Matomo
Best for: Organizations that want a Google Analytics replacement with optional product analytics features
Matomo is primarily a web analytics tool, but it offers product analytics capabilities through its plugin system. Heatmaps, session recordings, A/B testing, and funnels are available as paid plugins — even on self-hosted instances.
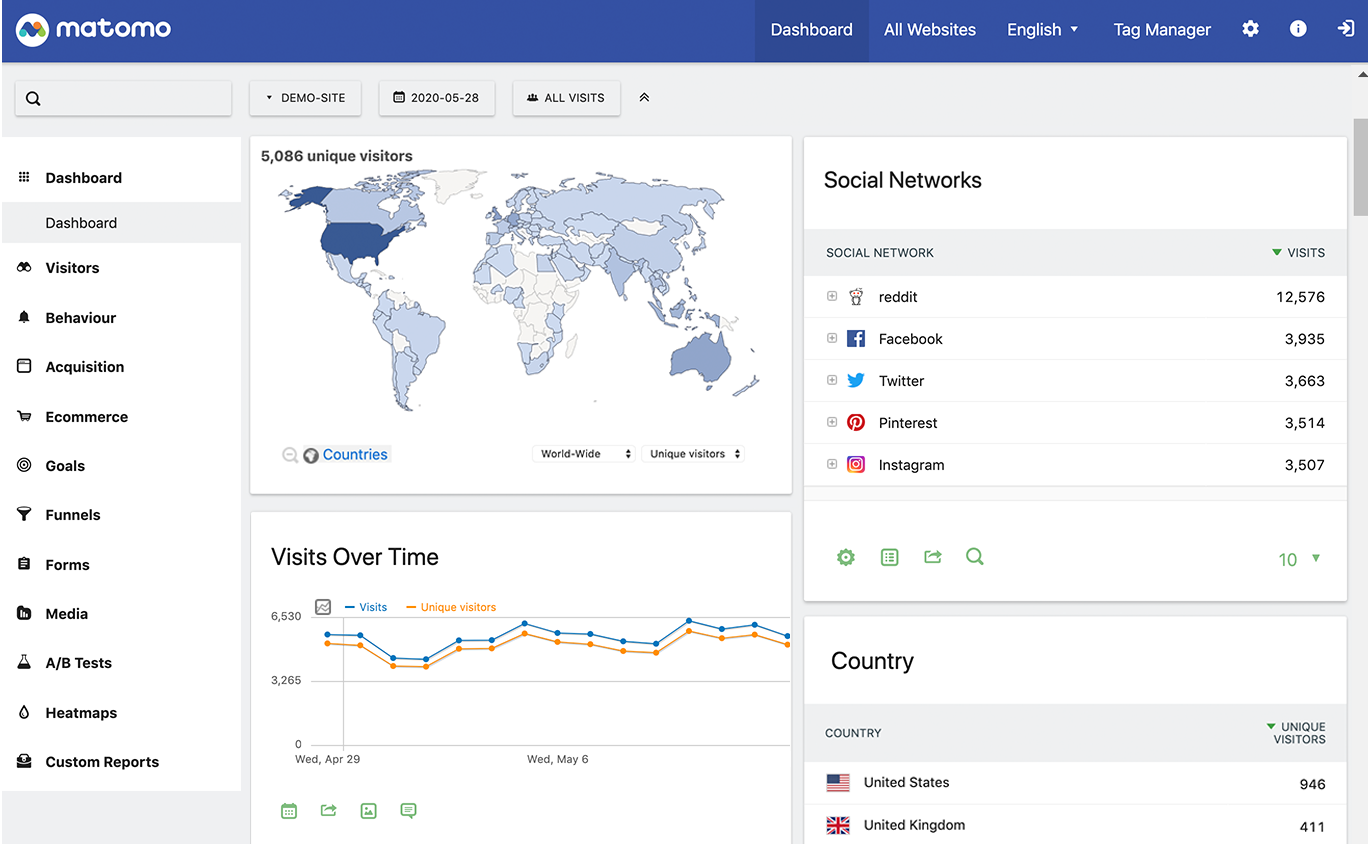
Product analytics features
- Funnels (paid plugin): Multi-step conversion funnels
- Cohorts (paid plugin): Group users by behavior and analyze over time
- Heatmaps (paid plugin): See where users click, scroll, and hover
- Session recordings (paid plugin): Watch recordings of user sessions
- A/B testing (paid plugin): Run experiments on your site
- Custom events: Track custom events and goals
Deployment
Matomo runs on PHP + MySQL/MariaDB. Deploy on any LAMP stack or use their Docker images. More complex than Docker-only tools because it requires a PHP environment and web server configuration.
Full details in our open source web analytics comparison.
Pricing
The core platform is free under GPL-3.0. Product analytics plugins are sold separately:
- Funnels: €199/year
- Heatmaps + Session Recording: €249/year
- A/B Testing: €199/year
- Cohorts: €79/year
These costs add up. A full product analytics setup on self-hosted Matomo can cost €500-700+/year in plugin licenses.
Pros
- Most mature self-hosted analytics platform (since 2007)
- Closest feature parity to Google Analytics
- Large plugin library
- Strong compliance track record
Cons
- Product analytics features are paid add-ons, not included in the core
- Plugin costs add up significantly
- PHP stack requires more maintenance
- Not a native product analytics tool — it's web analytics with product features bolted on
Compare with OpenPanel: Matomo vs OpenPanel
Mitzu
Best for: Data teams that want product analytics on top of their existing data warehouse
Mitzu takes a different approach. Instead of ingesting data into its own database, it runs analytics queries directly on your existing data warehouse (BigQuery, Snowflake, Databricks, etc.). If you already have event data in a warehouse, Mitzu gives you product analytics without duplicating data.
Product analytics features
- Funnels: Conversion funnel analysis running on your warehouse
- Retention: Cohort retention directly on warehouse data
- Segmentation: Filter users by any property in your warehouse
- User journeys: Path analysis on warehouse data
- Revenue analytics: Connect events to revenue data
Deployment
Mitzu deploys as a web application that connects to your existing warehouse. Self-hosting is available but requires a paid license.
Requirements: An existing data warehouse (BigQuery, Snowflake, Databricks, ClickHouse, or PostgreSQL) with event data already flowing in.
Pricing
Self-hosting requires a paid license (pricing available on request). Cloud plans are also custom-priced. There is no free tier for self-hosting.
Pros
- No data duplication — queries your existing warehouse
- Works with the data infrastructure you already have
- Strong for data teams who live in SQL and warehouses
- Good for organizations with complex data pipelines
Cons
- Requires an existing data warehouse with event data
- Self-hosting requires a paid license
- Not suitable for teams starting from scratch
- Smaller community and less documentation
Self-hosted product analytics vs cloud: when to self-host
The case for self-hosting product analytics is even stronger than for web analytics. Product analytics involves user-level data — individual users, their behaviors, their journeys through your product. This data is more sensitive than aggregate pageview counts.
Self-host product analytics when:
- You handle sensitive user data. Healthcare (HIPAA), finance, or any industry where user behavior data is regulated. Self-hosting eliminates third-party data transfers entirely. See our compliance guide.
- You need user-level data control. Product analytics tracks individual users. Under GDPR, this is personal data. Self-hosting gives you full control over retention, deletion, and access.
- You want cost predictability. Cloud product analytics pricing scales with events and identified users. At scale, this gets expensive fast. Self-hosting costs are your server costs.
- You have data residency requirements. Some regulations require data to stay in specific geographic regions. Self-hosting on your own infrastructure solves this.
Use cloud when:
- You're just getting started with product analytics. Cloud gets you insights faster. Self-host later when you've validated the tool fits your needs.
- You don't have ops capacity. Product analytics tools with ClickHouse backends need some database knowledge to maintain.
- You need guaranteed uptime. If analytics downtime directly impacts product decisions, a managed service with SLAs may be worth the cost.
With OpenPanel, you can start on Cloud and migrate to self-hosting at any time. The features are identical in both versions.
How to get started
1. Pick a server
For self-hosted product analytics, you'll want slightly more resources than for basic web analytics since product analytics involves more complex queries (funnels, retention calculations).
Recommended starting point: 4 vCPU, 8 GB RAM, 80 GB SSD. This handles most small-to-medium products comfortably.
- Hetzner — A CX31 (4 vCPU, 8 GB RAM) for around €8.50/month
- DigitalOcean — Equivalent droplet for ~$48/month
- Vultr — Similar pricing to DigitalOcean
2. Install and configure
For OpenPanel:
git clone -b self-hosting https://github.com/Openpanel-dev/openpanel && cd openpanel/self-hosting && ./setup
./start
The setup wizard walks you through domain configuration, database setup, SSL, and worker settings. Full guide: How to self-host OpenPanel.
3. Instrument your product
Product analytics requires event tracking in your codebase. With OpenPanel, install the SDK for your framework:
npm install @openpanel/nextjs
# or @openpanel/react, @openpanel/vue, @openpanel/sdk
Then track events where they happen:
import { op } from '@openpanel/nextjs';

// Track a custom event
op.track('signup_completed', {
  plan: 'pro',
  source: 'landing_page'
});

// Identify a user
op.identify({
  profileId: 'user_123',
  email: 'user@example.com',
  plan: 'pro'
});
See the SDK documentation for your specific framework.
4. Build your first funnel
Once events are flowing, create your first conversion funnel. A common starting point: Visit landing page > Sign up > Complete onboarding > First key action. This immediately shows you where users drop off in your core flow.
Related articles
 Comparison
13 Best Product Analytics Tools in 2026 (Ranked & Compared)
OpenPanel Team · 2025-07-18
 Comparison
Self-Hosted Web Analytics 2026 — Plausible vs Matomo vs Umami vs OpenPanel
OpenPanel Team · 2024-11-14
 Comparison
Open Source Analytics Tools: 2026 Survey of Privacy-First Options
OpenPanel Team · 2024-11-10