

Is conversion going up or down?
See how your conversion rates change over days, weeks, and months. Break down by any property to compare variants or campaigns, and catch regressions early.
- Conversion over time
- Breakdown by any property
- A/B test comparison
- AI-powered insights
What is conversion tracking?
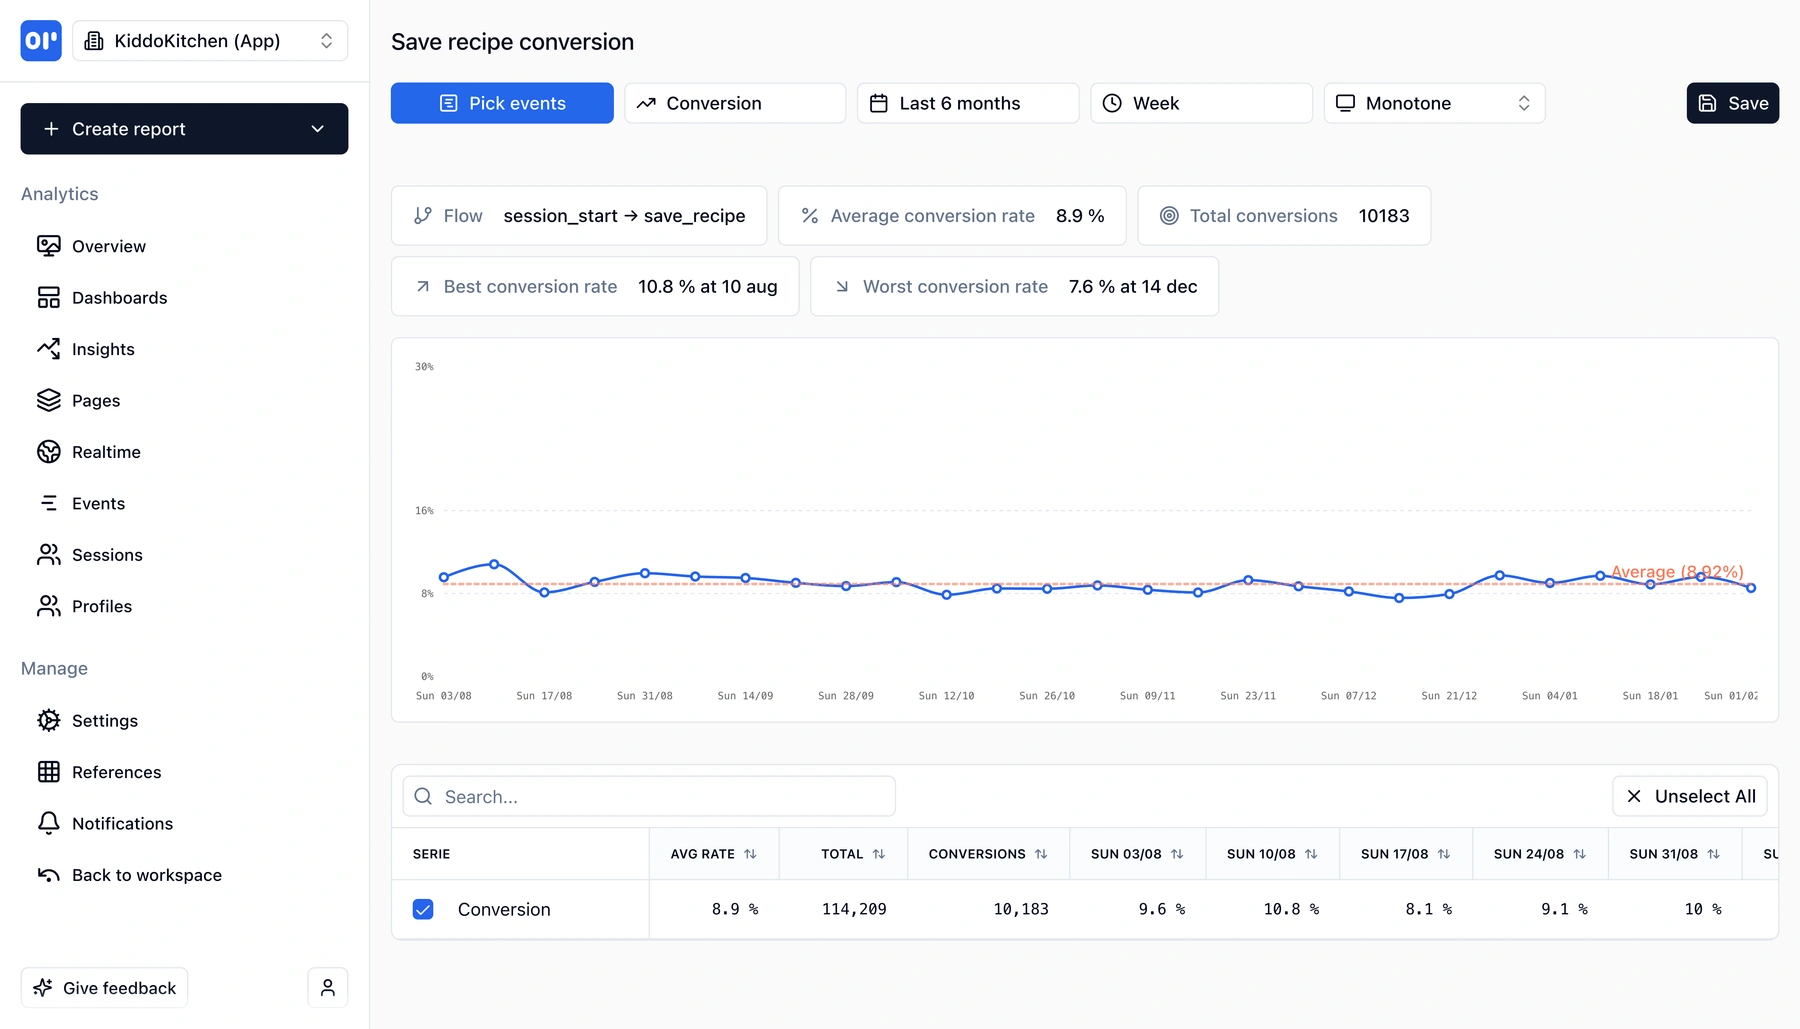
Conversion tracking measures the rate at which users complete a desired action-like going from session_start to save_recipe, or from signup to purchase. You define a flow (a start event and an end event), and OpenPanel calculates the conversion rate for every time period you choose.
If you're familiar with funnels, conversions will feel similar. Both measure whether users complete a sequence. The difference is perspective:
- Funnels are great for understanding where users drop off in a multi-step flow. They answer: "which step loses the most users?"
- Conversions are great for understanding trends. They answer: "is our conversion getting better or worse over time?"
With conversion tracking, you get:
- Conversion rate over time - see how your rate trends week over week or day by day. Spot improvements from product changes or regressions from bugs
- Average, best, and worst rates - instantly see your overall average and the specific time periods where conversion peaked or dipped
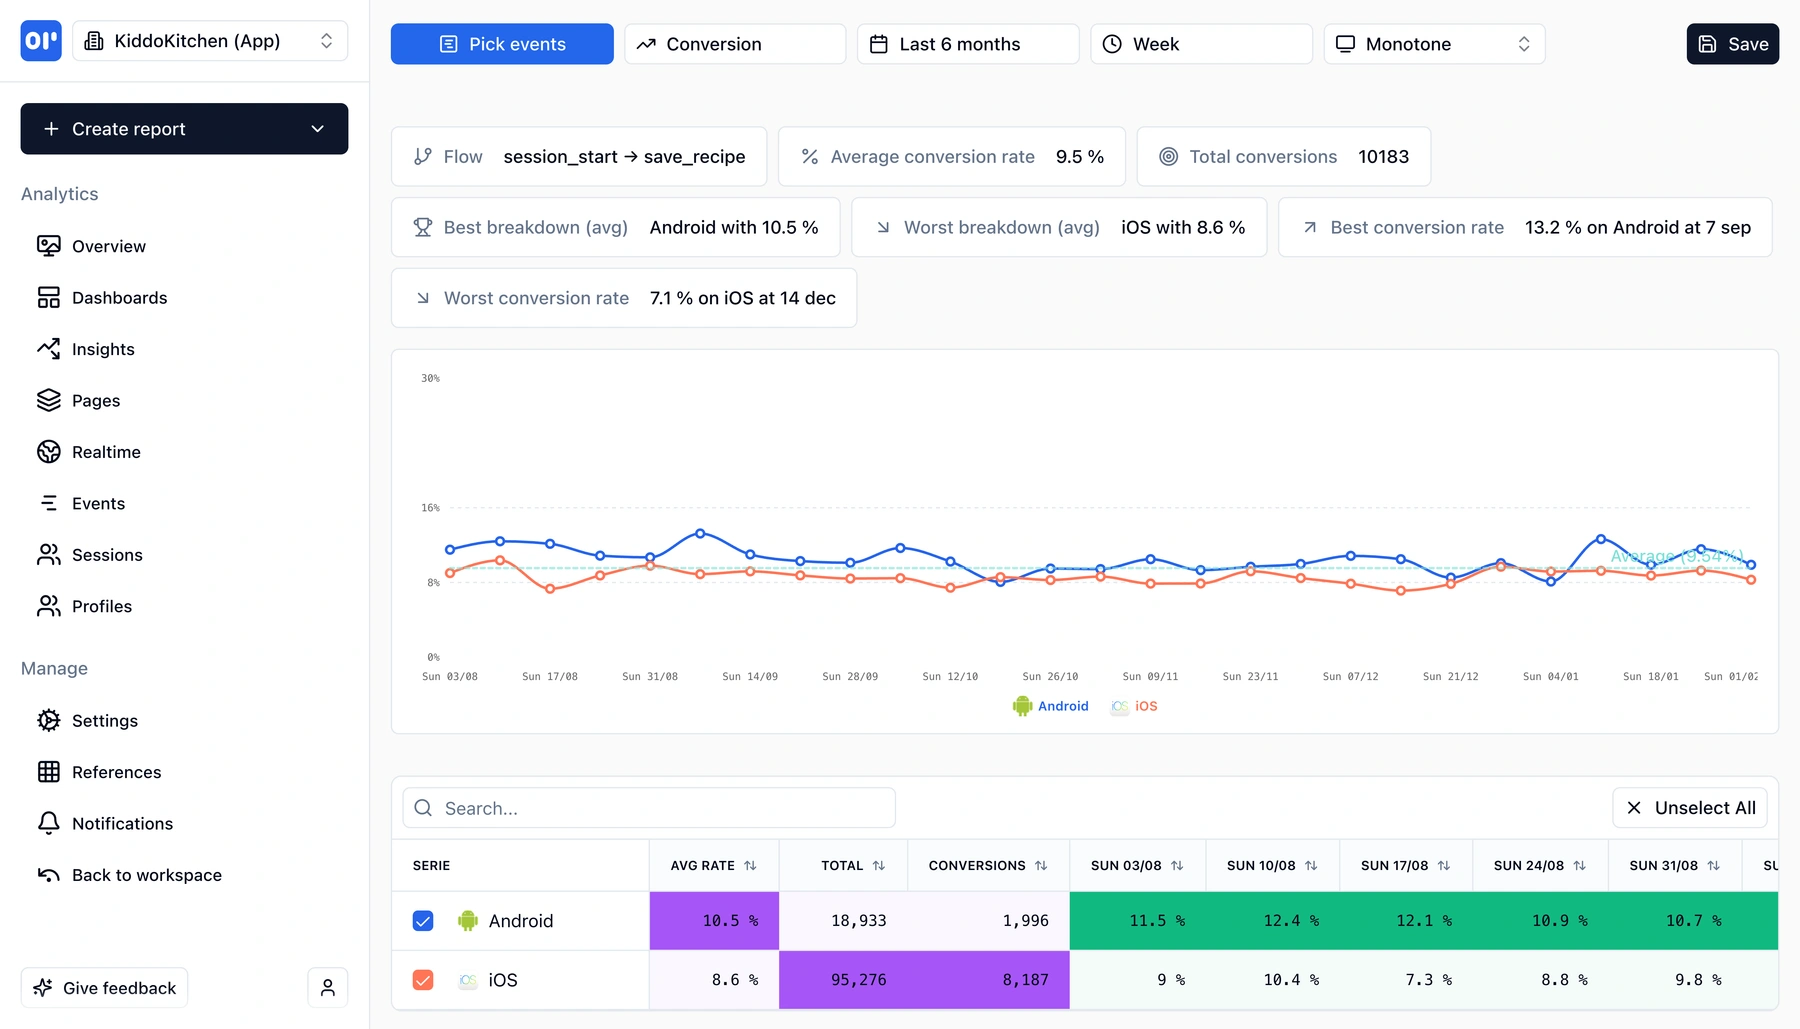
- Breakdowns - split conversion by any property (device, country, variant, campaign) to compare segments side by side. For A/B testing, break down by experiment variant and see which one converts better, with per-period granularity
- Total conversions - absolute numbers alongside rates, so you understand volume as well as percentage
Conversion reports in OpenPanel are built on the same events you already track. Define a flow once, and you get a live chart that shows whether your product is converting more or fewer users over time.
No sampling, no delayed processing. Every event counts, and results update in real time.
What you can do with conversions
Monitor, compare, and optimize your most important flows.
Conversion trends over time
See your conversion rate plotted over days, weeks, or months. Spot trends, seasonal patterns, and the impact of product changes.
Breakdowns for A/B testing
Split conversion by any property-experiment variant, device, country, or traffic source. Compare lines on the same chart to see which segment converts best.
Smart insights
OpenPanel highlights your best and worst performing periods and breakdowns automatically. See which variant had the highest average rate and when the lowest dip occurred.
Flexible flow definition
Define a conversion as any two events: a start (e.g. session_start) and a goal (e.g. purchase). Change events or time windows without re-instrumenting.
Per-period detail table
Below the chart, a table shows conversion rate for every period (week, day, month) for each segment. Sort and search to find exactly the data point you need.
Save and share reports
Save conversion reports with their configuration and add them to dashboards. Share with your team so everyone monitors the same metrics.
How conversion tracking works
Set up a conversion report in seconds using events you already track.
Pick your events
Choose a start event (e.g. session_start) and a goal event (e.g. save_recipe, purchase). These are events you already send-no extra instrumentation.
Choose your time range and granularity
Select a date range and whether to view conversion by day, week, or month. OpenPanel calculates the rate for each period.
Add breakdowns (optional)
Break down by device, country, experiment variant, or any event property. Each breakdown value gets its own line on the chart and row in the table.
Monitor trends and act
Watch your conversion rate over time. Spot regressions early, validate that product changes improve conversion, and compare A/B test variants with real data.
Who uses conversion tracking
Teams that need to monitor and improve conversion over time.
Growth and product teams
Monitor signup-to-activation or trial-to-paid conversion week over week. Validate that product changes actually move the needle-not just in aggregate, but period by period.
A/B testing and experimentation
Break down conversion by experiment variant to see which version wins. Unlike simple A/B tools, you get per-period granularity so you can spot if a variant's advantage changes over time.
Marketing and campaigns
Compare conversion rates across traffic sources, campaigns, or landing pages. Find out which channels convert best and whether performance is improving or declining.
Mobile and cross-platform teams
Break down by platform (iOS vs Android), app version, or device type. Catch platform-specific regressions and prioritize fixes where conversion is lowest.
Related features
Explore more capabilities that work together with this feature.
Funnels
See where users drop off step by step. Funnels show you which step loses users-conversions show you how rates trend over time.
Event tracking
Conversions are built on the events you track. Send events once and use them for conversions, funnels, retention, and more.
Retention
Conversion measures if users complete an action. Retention measures if they keep coming back.
Data visualization
Conversion charts are one of many ways to visualize your data in OpenPanel.
Frequently asked questions
Common questions about conversion tracking in OpenPanel.
Ready to get started?
Track events in minutes. Free 30-day trial, no credit card required.
Track your first conversion