

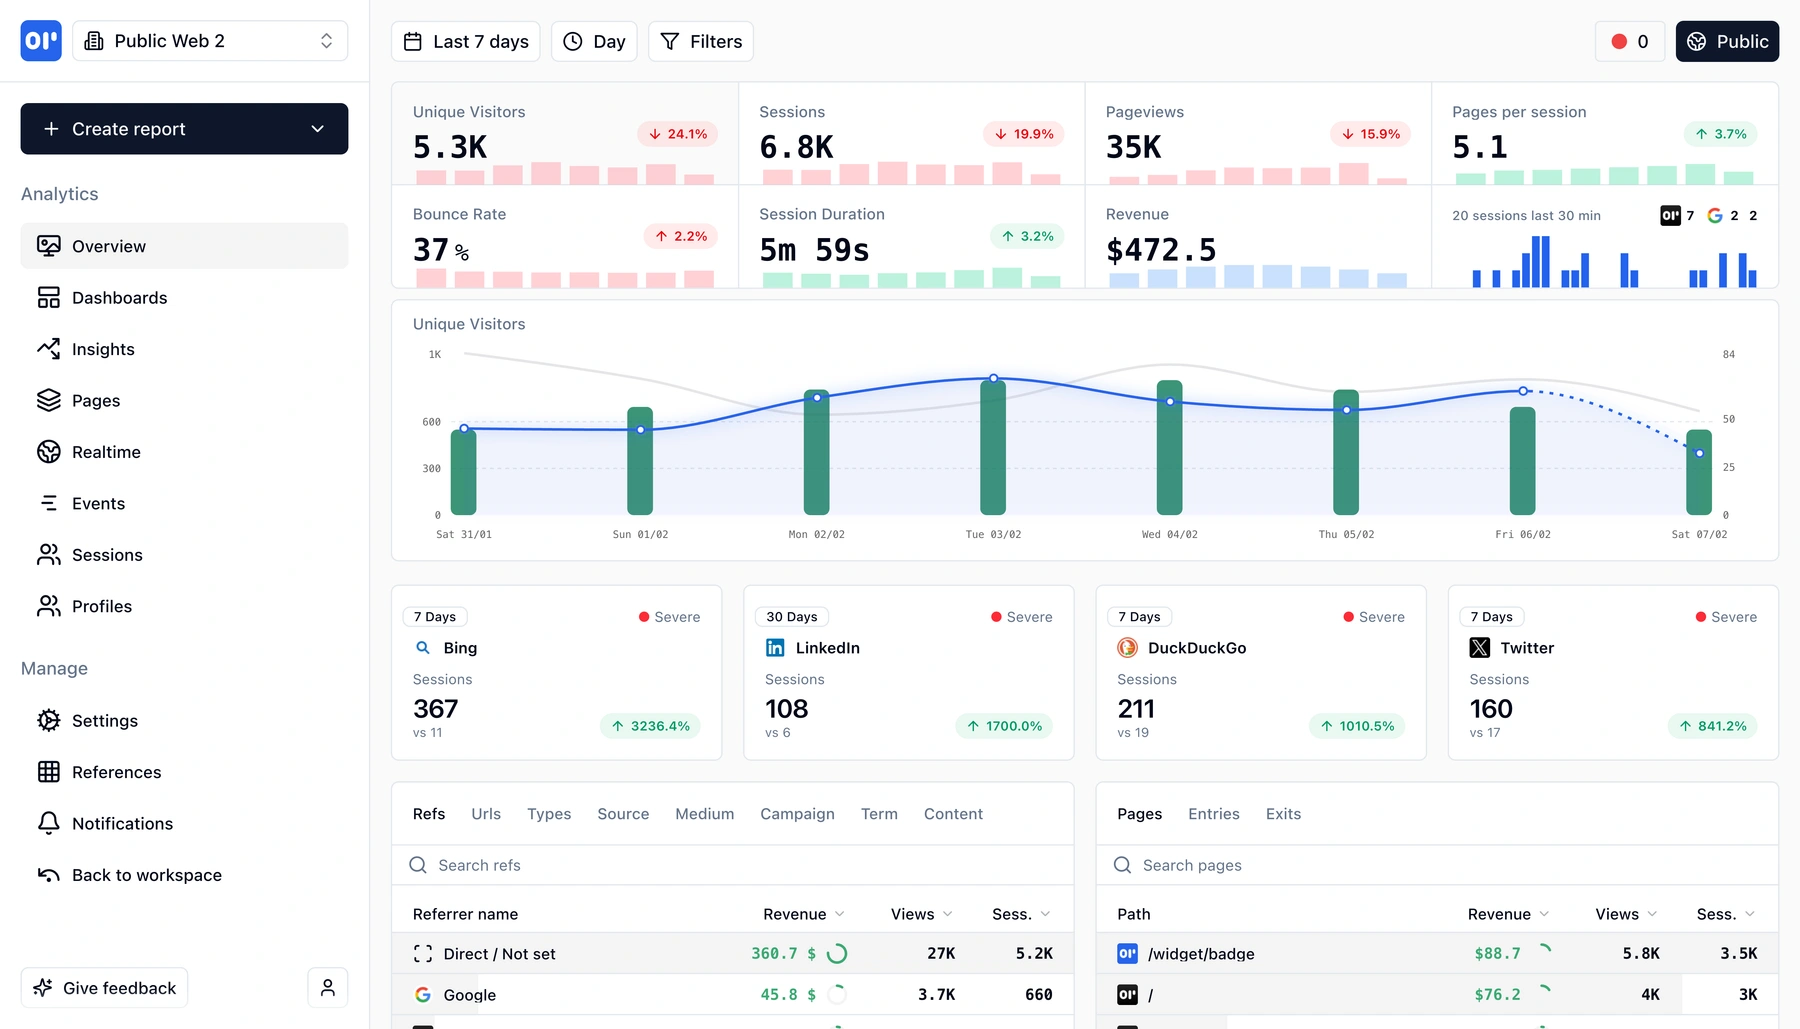
Revenue tracking
Attach a dollar value to any action - purchase, upgrade, renewal - and see exactly how money flows through your product. No spreadsheets, no stitching.
- Revenue as events
- Tie revenue to users
- Real-time metrics
- No spreadsheets needed
What is event-based revenue tracking?
Most teams track revenue in spreadsheets or payment dashboards that live completely separate from product analytics. You know how much you made, but not why.
Event-based revenue tracking flips this. Every revenue moment-a purchase, a plan upgrade, a subscription renewal-is captured as a structured event with a dollar amount, a user, and a session. That means you can answer questions like:
- Which signup source drives the most revenue?
- How long after onboarding do users make their first purchase?
- What features do high-LTV customers use that churning ones don't?
With OpenPanel, you send a revenue event the same way you send any other event-just include an amount property. From there, revenue flows into funnels, retention charts, and user profiles alongside every other action.
No CSV exports. No stitching Stripe data to analytics data in a spreadsheet. Revenue becomes a first-class dimension of your product analytics, queryable and filterable like everything else.
Because OpenPanel is privacy-first, revenue data stays in your infrastructure (self-hosted) or in our cloud with no third-party sharing.
What you can measure
From single purchases to recurring subscriptions, every revenue signal becomes a queryable event.
Revenue events with custom amounts
Attach a monetary value to any event. Track purchases, upgrades, add-ons, and refunds as structured data.
Revenue per user and session
Every revenue event is linked to a user and session, so you can see lifetime value, average order value, and revenue per visit.
Revenue in funnels
Add revenue events as funnel steps. See how much money flows through each stage-and how much you lose at every drop-off.
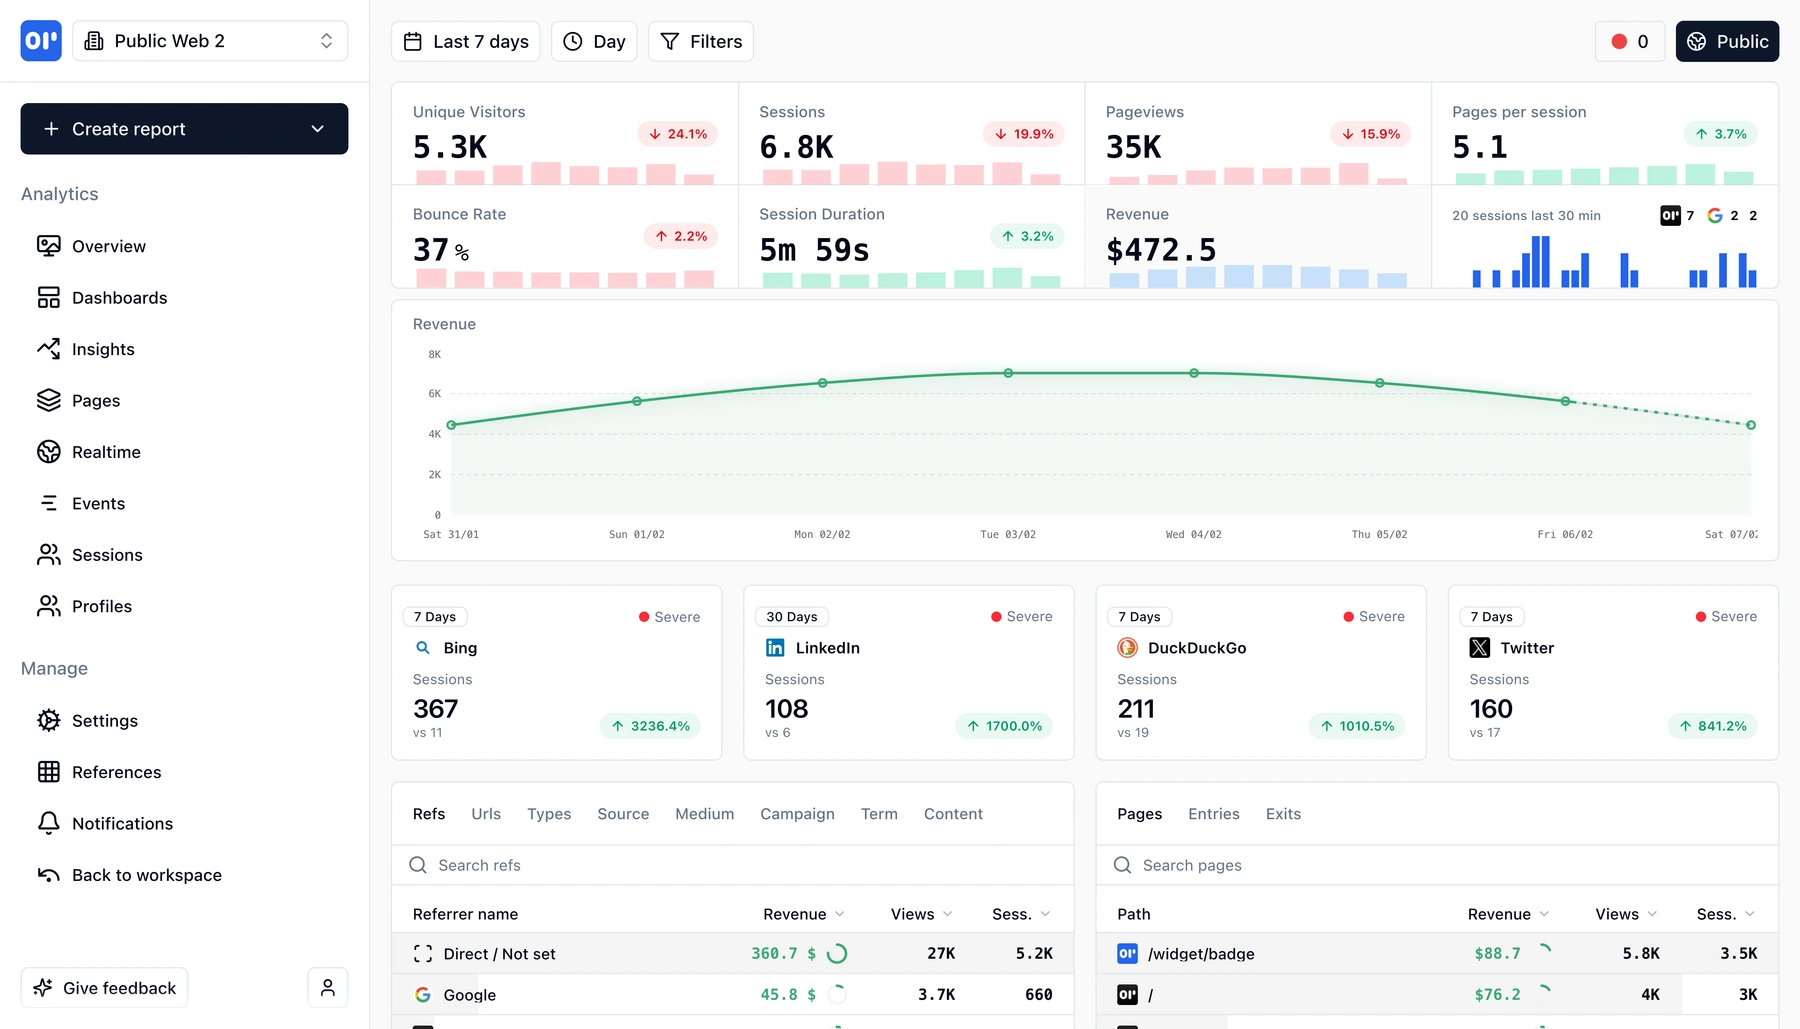
Revenue over time
Chart daily, weekly, or monthly revenue trends. Break down by plan, source, country, or any event property.
Segment by properties
Filter revenue by plan tier, payment method, campaign source, or any custom property you attach to your events.
Real-time ingestion
Revenue events appear in dashboards within seconds-no overnight processing or batch imports.
How revenue events work
Three steps to go from payment callbacks to full revenue analytics.
Send revenue events from your backend
When a purchase, upgrade, or renewal happens, fire an event with the amount and any relevant properties (plan, currency, item).
Revenue ties to the user and session
OpenPanel links the revenue event to the user who triggered it and the session they were in. No manual joins-context is automatic.
Analyze in dashboards, funnels, and profiles
Revenue shows up everywhere: aggregate charts, conversion funnels, user timelines. Filter and break down by any property.
Who uses revenue tracking
Teams that want to connect product behavior to business outcomes.
SaaS product teams
Tie MRR and expansion revenue back to feature usage. Understand which product changes move the revenue needle.
E-commerce and marketplaces
Track order value per session, revenue by traffic source, and purchase funnels without a separate BI tool.
Growth and marketing
Measure campaign ROI by linking ad spend to actual revenue events. See which channels produce paying users, not just signups.
Related features
Explore more capabilities that work together with this feature.
Frequently asked questions
Common questions about tracking revenue with OpenPanel.
Ready to get started?
Track events in minutes. Free 30-day trial, no credit card required.
Start tracking revenue